
SDG 13.2.2
SDG 13.2.2 Low-carbon energy use
Total energy used
In 2025, total electricity consumption was 8,281,211 kWh at Jinde Campus and 4,271,440 kWh at Shida Campus. NCUE's total electricity consumption across all campuses was 12,552,651 kWh, equivalent to 45189.54 GJ.
Total energy used from low-carbon sources
1. Since 2017, Jinde Campus has operated a 467 kWp photovoltaic system with an average annual generation of 583,750 kWh (2,101.5 GJ), equal to 7.05% of Jinde Campus's total electricity consumption in 2025.
2. In 2021–2022, NCUE increased annual solar generation to 3,197,968 kWh (11,512 GJ) at Jinde Campus and to 714,375 kWh (2,572 GJ) at Shida Campus, together equal to 31.17% of NCUE's total electricity consumption in 2025 (see Table 1).
3. Under NCUE's current plan for 2026–2030, annual solar generation will increase to 3,485,469 kWh (12,548 GJ) at Jinde Campus and to 1,636,875 kWh (5,893 GJ) at Shida Campus.
4. By 2030, NCUE's total solar generation is expected to increase by a further 5,122,344 kWh (18,440 GJ), over 40.8% of NCUE's total electricity consumption in 2025. Table 1 summarizes NCUE's low-carbon energy usage for 2021–2030.
| Campus | Year | Newly Added Capacity (kWp) | Accumulated Capacity (kWp) | Expected Power Generation (kWh) | Percent of Total Power Consumption in 2025 |
|---|---|---|---|---|---|
| Jinde | Before 2020 | 467 | 467 | 583,750 | 7.04% |
| 2021~2022 | 2091.375 | 2558.375 | 3,197,968 | 38.62% | |
| 2026~2030 | 230 | 2788.375 | 3,485,469 (12,548GJ) |
42.09% | |
| Shida | Before 2020 | 0 | 0 | 0 | 0% |
| 2021~2022 | 571.5 | 571.5 | 714,375 | 16.72% | |
| 2026~2030 | 738 | 1309.5 | 1,636,875 (5,893GJ) |
38.32% | |
| Total | Before 2020 | 467 | 467 | 583,750 | 4.65% |
| 2021~2022 | 2662.875 | 3129.875 | 3,912,344 | 31.17% | |
| 2026~2030 | 968 | 4097.875 | 5,122,344 (18,440GJ) |
40.8% |
5. NCUE is also making concerted efforts to achieve carbon neutrality progressively. Before 2020, Jinde Campus had installed solar power capacity of 467 kW, about 15.57% of the campus's peak electricity demand of 3,000 kW. Shida Campus had a peak demand of 1,000 kW, with a low-carbon energy share of 0%.
6. In 2021–2022, installed solar capacity at Jinde Campus increased to 2,558.375 kWp while peak demand fell to 2,600 kW, giving a low-carbon energy share of 98.4%. At Shida Campus, installed solar capacity increased to 571.5 kWp and peak demand fell to 900 kW, giving a low-carbon energy share of 63.5%.
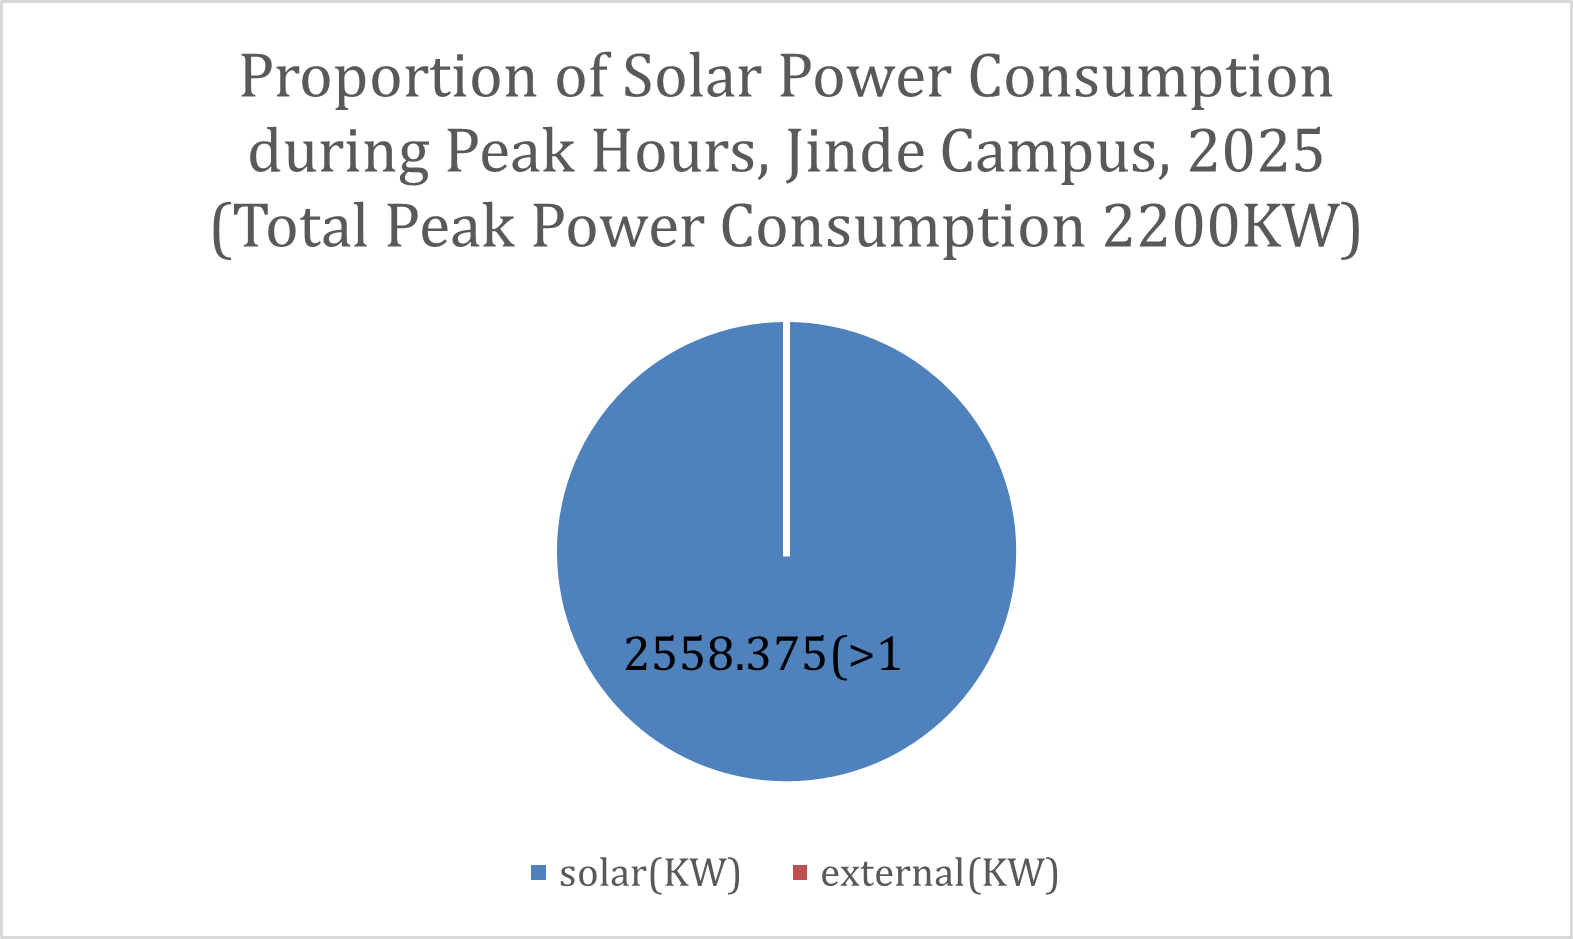
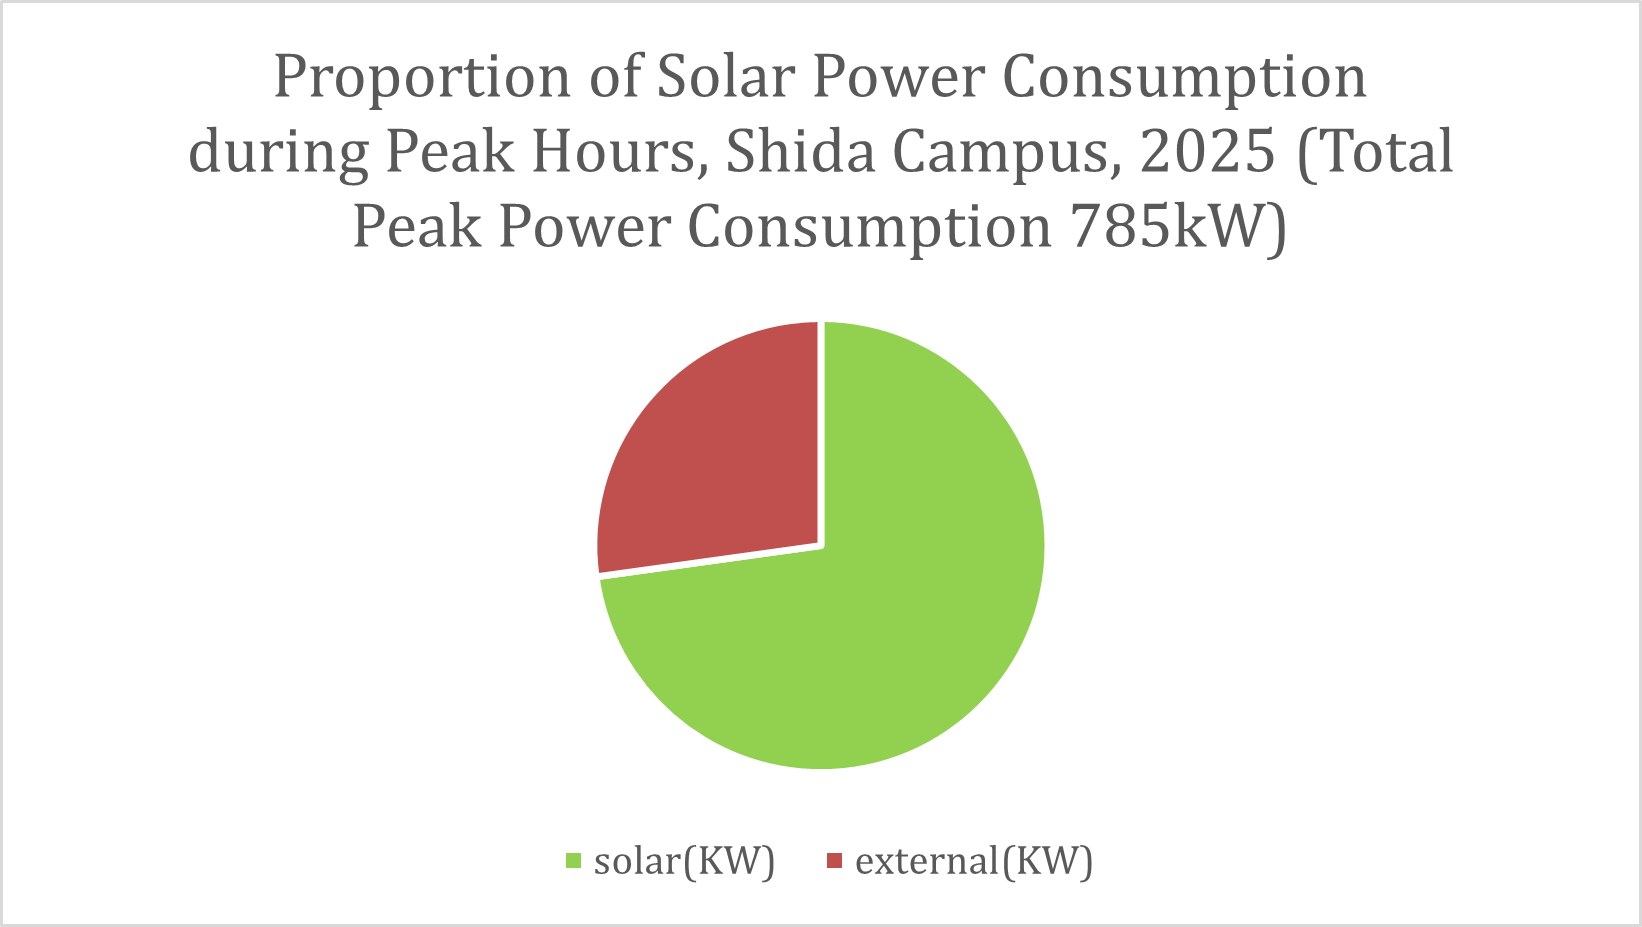
7. In 2025, NCUE maintained the installed solar capacity of 2021–2022. Peak electricity demand at Jinde Campus has fallen to 2,200 kW, giving a low-carbon energy share above 100%, and peak demand at Shida Campus has fallen to 785 kW, giving a low-carbon energy share above 72.8%. Details are shown in Table 2. Table 2 presents NCUE's 2021-2030 Total Planned New Solar Power Installation Capacity.
| Campus | Year | Installed Solar Capacity (kWp) | Peak Electricity Demand (kW) | Proportion of Solar Power to Power Consumption |
|---|---|---|---|---|
| Jinde | Before 2020 | 467 | 3000 | 15.57% |
| 2021-2022 | 2558.375 | 2600 | 98.4% | |
| 2026~2030 | 2788.375 | 2200 | >100% | |
| Shida | Before 2020 | 0 | 1000 | 0% |
| 2021-2022 | 571.5 | 900 | 63.5% | |
| 2026~2030 | 1309.5 | 785 | >100% |
(1) Table 3 lists the solar power generation systems installed at Jinde Campus and Shida Campus in 2022, by building.
| Campus | Building | Installed Capacity (kWp) | Estimated power generation (kwh/year) |
|---|---|---|---|
| Jinde Campus | Qiao-Si Hall | 69 | 94,687 |
| Baisha Building (Administration) | 191.625 | 239,531 | |
| Zhi-Shan Hall | 48 | 60,000 | |
| Ming-De Hall | 85.125 | 80,156 | |
| Academic Main Hall (Teaching Building) | 92.25 | 115,312 | |
| Student Dorm 8 | 189 | 236,250 | |
| Student Dorm 7 | 181.5 | 226,875 | |
| Student Dorm 6 | 88.5 | 110,625 | |
| Hu-Bin Building | 123 | 153,750 | |
| Main Library | 133.5 | 183,281 | |
| Multipurpose Center | 103.875 | 129,843 | |
| Student Canteen | 146.625 | 183,281 | |
| Sheng-Yang Hall | 99.375 | 124,218 | |
| Xue-Si Building | 36 | 45,000 | |
| Wang Jin-Ping Activity Center | 160.65 | 192,187 | |
| Wang Jin-Ping Natatorium | 239.4 | 302,812 | |
| Old Activity Center | 103.95 | 129,375 | |
| Jinde Campus Total | 2091.375 | 2,607,183 | |
| Shida Campus | Student Dorm 9 | 99.75 | 125,625 |
| Teaching Building 1 | 69.75 | 126,563 | |
| College of Engineering | 139.5 | 174,375 | |
| Jing-Shi Hall | 114.375 | 142,969 | |
| Li-Xing Hall | 148.125 | 185,156 | |
| Shida Campus Total | 571.5 | 754,688 |
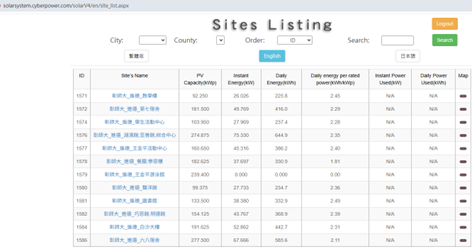
(2) NCUE accesses solar power generation information through real-time solar monitoring systems to effectively manage and track solar power generation efficiency. NCUE's solar monitoring system interface is shown in Figure 1.
System website: http://solarsystem.cyberpower.com/solarV4/id_login.aspx
(3) The proportion of solar power consumption during peak hours at NCUE's Jinde and Shida campuses in 2025 is shown in Figures 2-3.
(4) NCUE is planning new rooftop and ground-mounted PV systems for 2026–2030, adding 230 kWp at Jinde Campus and 738 kWp at Shida Campus. Table 4 lists the planned installations.
| Campus | Location | Estimated Capacity (kWp) | Estimated Annual Power Generation (kWh/year) |
|---|---|---|---|
| Jinde Campus | College of Science Buildings 1 & 2 | 230 kWp | 287,500 |
| Shida Campus | Xuanli Stadium | 154.7 kWp | 193,375 |
| Li-Xing Hall 3F | 40.95 kWp | 51,187 | |
| Student Dorm 10 | 86.6 kWp | 108,250 | |
| Innovation Incubation Center | 31 kWp | 38,750 | |
| College of Engineering 3F | 65 kWp | 81,250 | |
| Volleyball Court | 179.875 | 224,844 | |
| Tennis Court | 179.875 | 224,844 | |
| Campus-wide (Total) | 968 kWp | 1,210,000 | |