SDG 13.2.1
SDG 13.2.1 Low carbon energy tracking
1. NCUE's 2025 Low-Carbon Energy Usage Statistics
(1) NCUE is committed to promoting green campus construction and actively introducing low-carbon energy systems. The 2025 energy usage statistics are as follows:
(a) NCUE's total energy consumption in 2025, which is equivalent to the total electricity consumption, was 12,552,651 kWh = 45189.54 GJ
(b) NCUE's low-carbon energy usage in 2025 amounted to 3,998,415 kWh = 14,394 GJ
(c) All low-carbon energy used by NCUE comes from the photovoltaic (PV) systems installed on its campuses.
(2) Overview of Solar Power Generation Facilities
NCUE has installed PV systems at Jinde Campus and Shida Campus:
(a) Jinde Campus installed capacity: 2,558.375 kWp
(b) Shida Campus installed capacity: 571.5 kWp
(c) Total installed capacity: 3,129.875 kWp
(3) Power Generation Calculation Basis
Based on the average daily sunlight duration of 3.5 hours in the Changhua region of Taiwan, the total solar power generation in 2025 was:
(2,558.375 + 571.5) × 365 × 3.5 = 3,998,415 kWh = 14,394 GJ
2. NCUE's Mechanism for Tracking Low-Carbon Energy Usage
(1) Each year, NCUE compiles statistics on total campus energy usage, low-carbon energy usage, and the low-carbon energy share. Using data from its solar power monitoring systems and energy management records, NCUE continuously tracks renewable energy generation and campus energy usage. These data guide energy management and adjustments to carbon reduction policies.
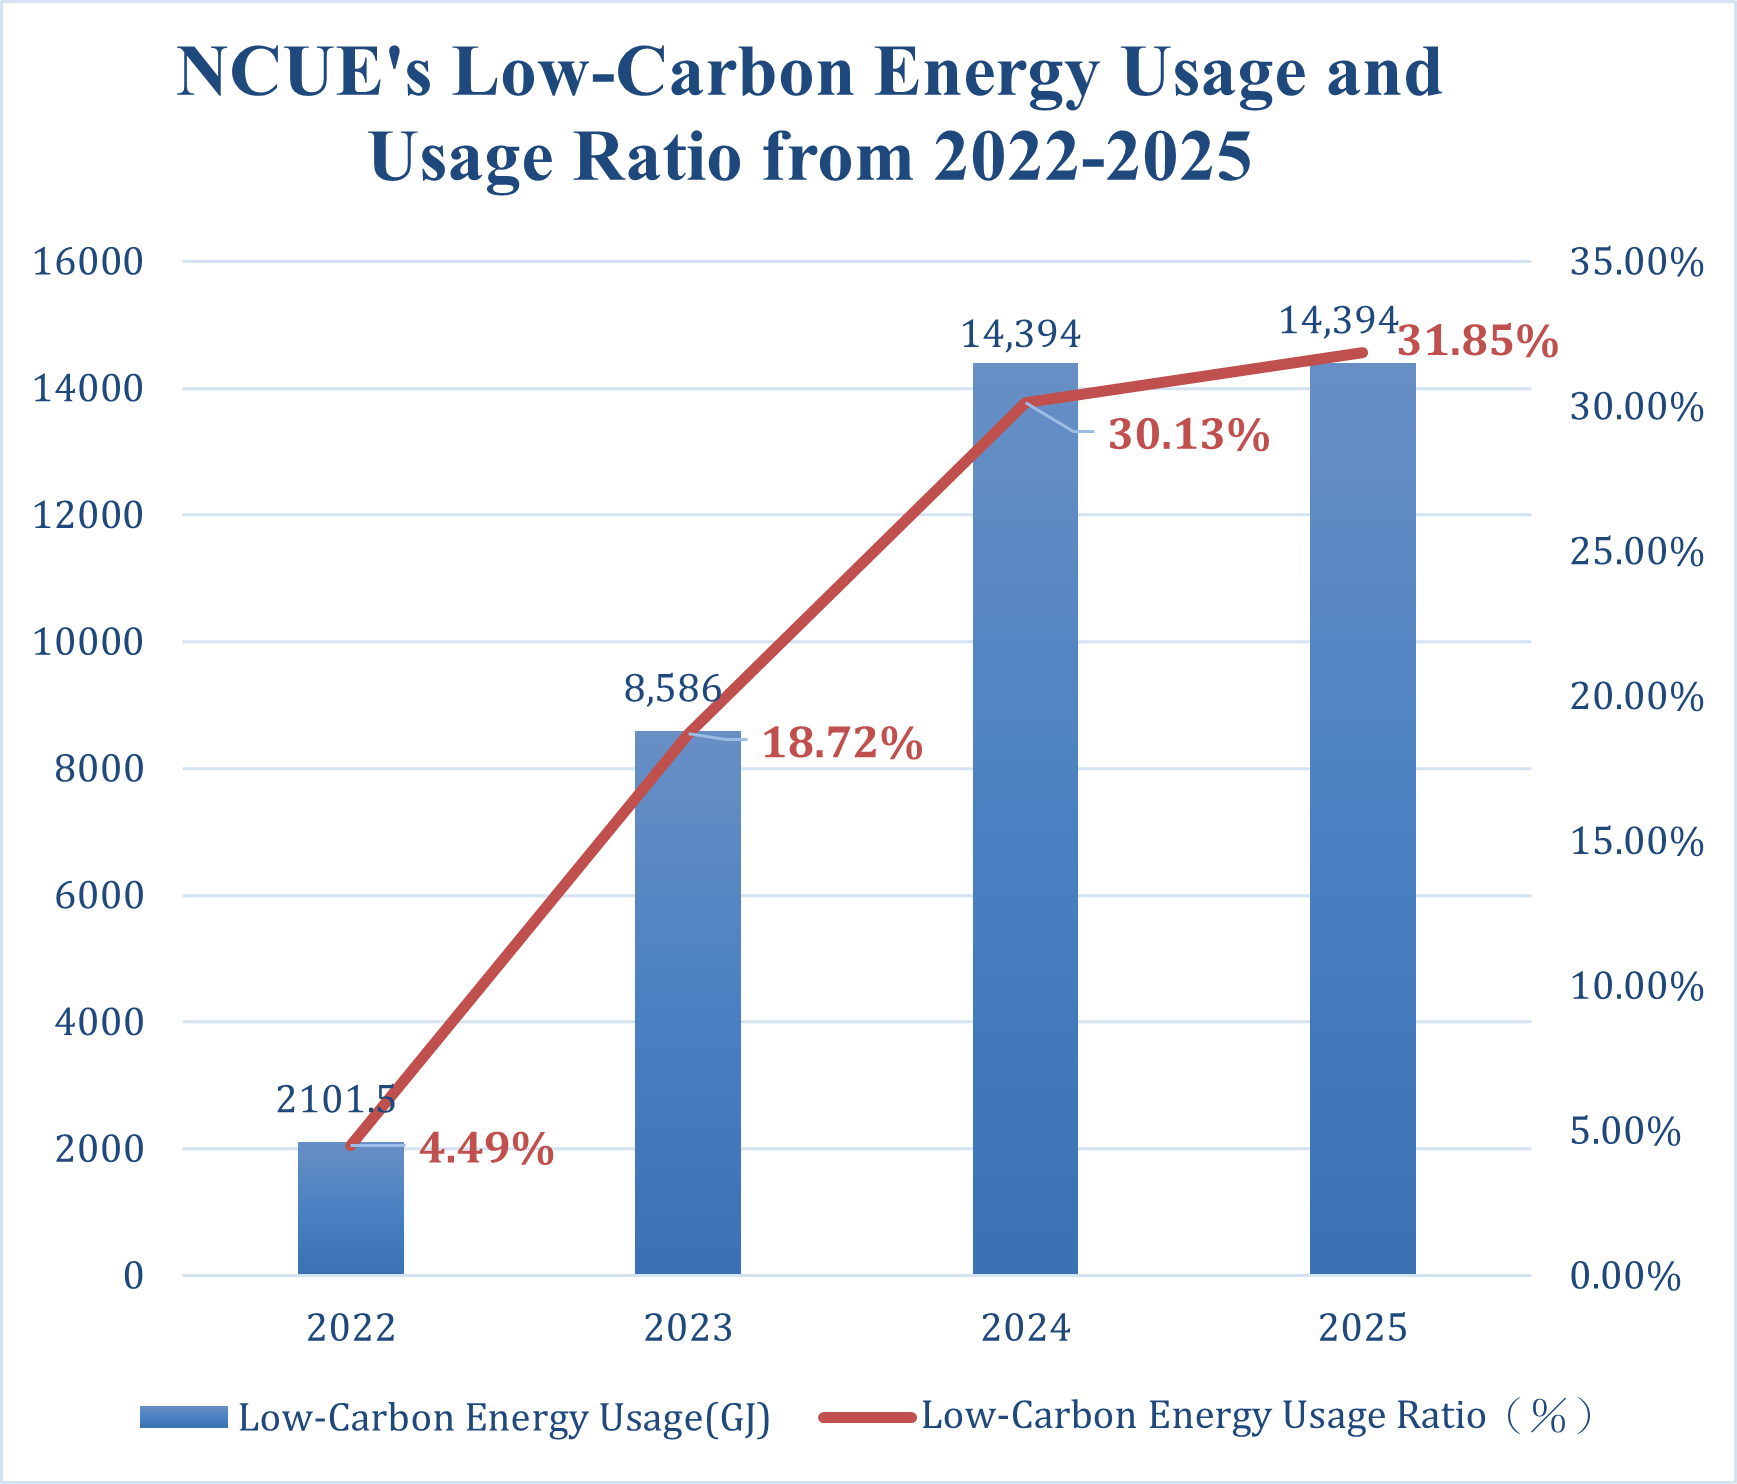
NCUE's low-carbon energy usage ratio has risen steadily from 2022 to 2025, as detailed in Table 1.
| Year | Low-Carbon Energy Usage (GJ) | Total Energy Usage (GJ) | Low-Carbon Energy Usage Ratio (%) |
|---|---|---|---|
| 2022 | 2101.5 | 46756.12 | 4.49% |
| 2023 | 8,586 | 45871.88 | 18.72% |
| 2024 | 14,394 | 47757.19 | 30.13% |
| 2025 | 14,394 | 45189.54 | 31.85% |
(2) NCUE's low-carbon energy usage ratio increased significantly from 18.72% in 2023 to 31.85% in 2025. The main reasons for this increase are analyzed as follows:
(a) Stable Operation of the Solar Power Generation System, Sustaining a High Level of Low-Carbon Energy Supply.
NCUE's solar power generation system was officially completed and connected to the grid at the end of May 2023.
i. Year 2023: Only power generation data from June to December was included, representing "partial-year operation."
ii. Year 2024: This was the first full year of operation following the completion of the solar power generation system. As the reporting period expanded from seven months to a full year, low-carbon energy usage increased from 8,586 GJ to 14,394 GJ.
iii. Year 2025: Low -carbon energy usage remained at 14,394 GJ, indicating that the renewable energy supply has entered a stable and mature stage, capable of sustainably meeting campus energy demand.
(b) Continued Implementation of Energy-Saving Measures to Increase the Low-Carbon Energy Usage Ratio
NCUE continues to implement measures such as replacing high-efficiency air conditioning and lighting equipment, optimizing the energy management system, managing building electricity usage, and promoting energy-saving awareness, in accordance with the "National Changhua University of Education Guidelines for Promoting Energy Conservation and Carbon Reduction," effectively lowering overall campus energy demand. Although low-carbon energy usage in 2025 remained at 14,394 GJ, total energy usage decreased from 47,757.19 GJ to 45,189.54 GJ, raising the low-carbon energy usage ratio from 30.13% to 31.85%. This shows that, in addition to continuing to provide a stable renewable energy supply, NCUE has simultaneously improved energy use efficiency and its overall energy mix, thereby gradually reducing the carbon footprint associated with campus energy consumption.
3. Low-Carbon Energy Development Outcomes
From 2022 to 2025, NCUE's low-carbon energy usage increased from 2,101.5 GJ to 14,394 GJ, and its share of total energy consumption rose from 4.49% to 31.85%, a steady upward trend shown in Figure 1. The increase from 2023 to 2024 came mainly from the full operation of the solar power generation system. In 2025, low-carbon energy remained stable, while a decrease in total energy consumption raised the low-carbon energy usage ratio to 31.85%. Overall, these results demonstrate that NCUE has thus established a stable low-carbon energy supply system. By continuously tracking low-carbon energy usage, total energy usage, and the low-carbon share, NCUE monitors energy trends in real time and evaluates the results of its energy-saving measures and renewable energy installations. These data inform future energy management, equipment replacement, and low-carbon campus planning as NCUE works toward a low-carbon campus and carbon neutrality by 2045.
4. Real-Time Low-Carbon Energy Monitoring Platform
To effectively manage and track NCUE's solar power generation efficiency, NCUE accesses real-time power generation data, historical statistical information, and system operating status of photovoltaic equipment at all campuses through real-time monitoring systems, ensuring stable operation of solar equipment and maximizing power generation benefits. Annual low-carbon energy usage data is also regularly compiled to serve as an important basis for energy management, performance analysis, and review of campus carbon reduction strategies. This ensures that low-carbon energy usage is systematically tracked and monitored, with mechanisms in place for continuous improvement.
(1) NCUE Gymnasium Solar Power Real-Time Monitoring System
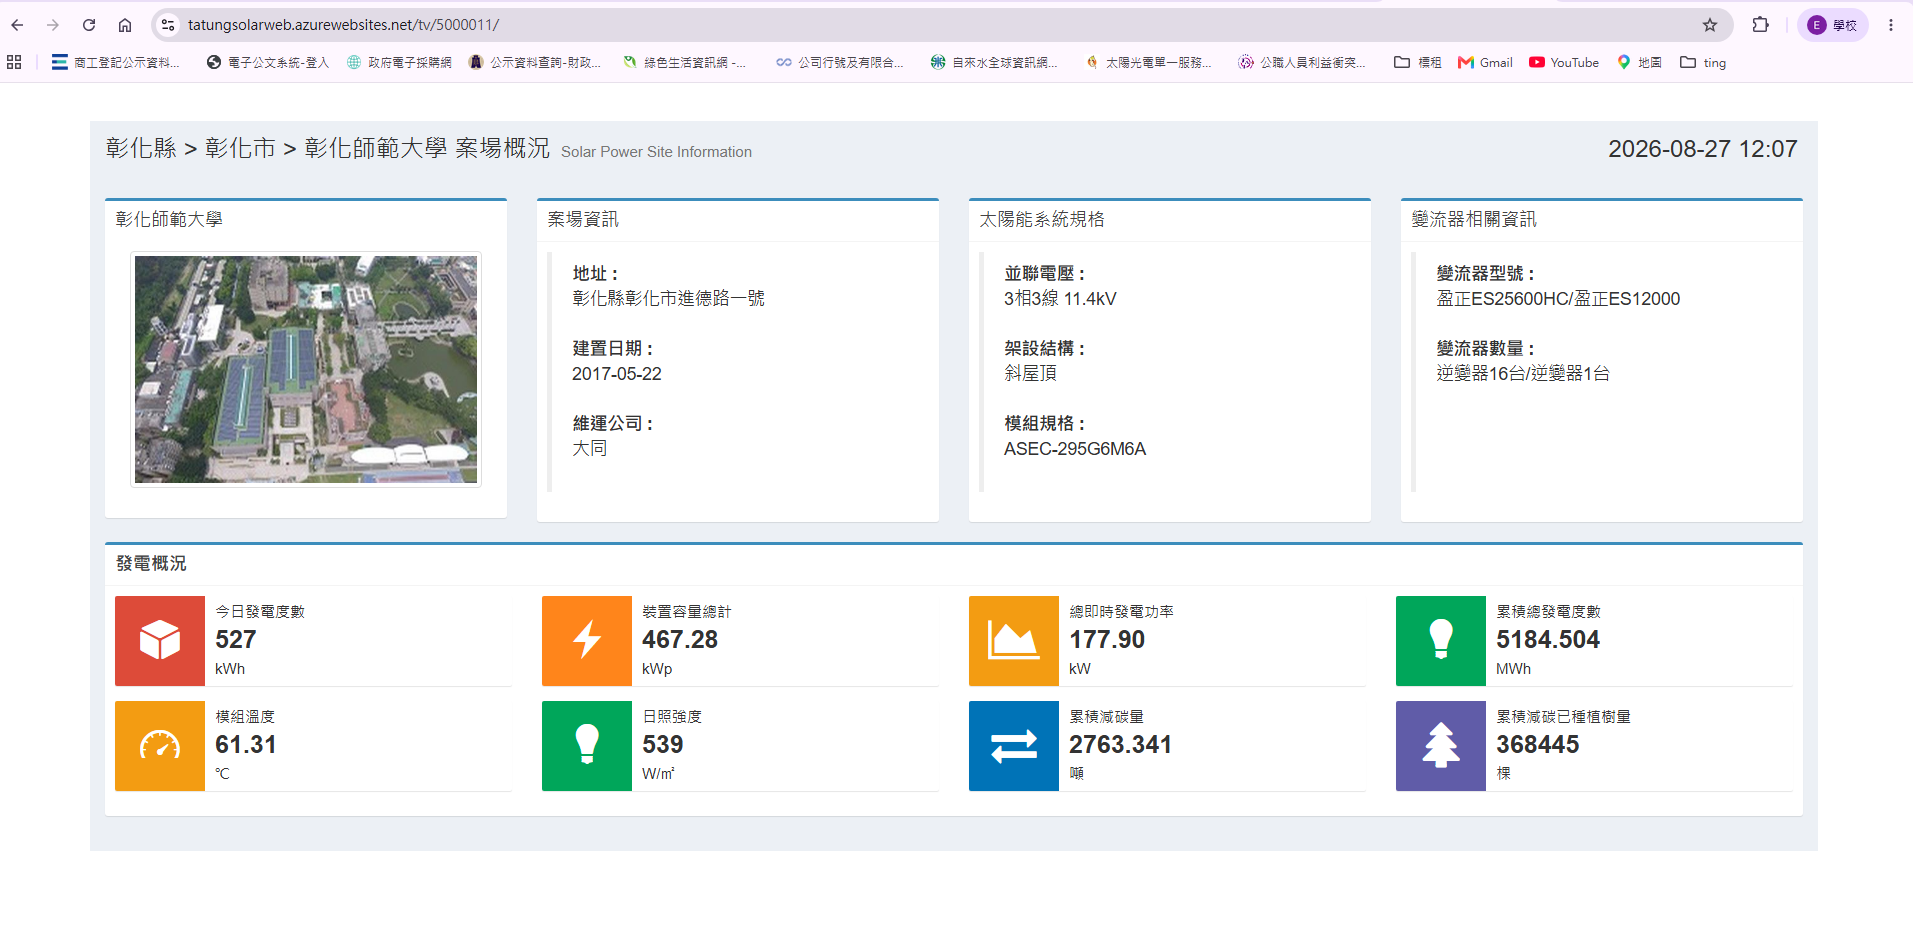
System interface shown in Figure 2, website: https://tatungolarweb.azurewebsites.net/tv/5000011/
This system specifically monitors the rooftop solar power generation equipment of the gymnasium, providing key data such as real-time generation power, cumulative power generation, and system efficiency to help management personnel monitor equipment operation status in real-time.
(2) Solar Power Monitoring System for Other Buildings
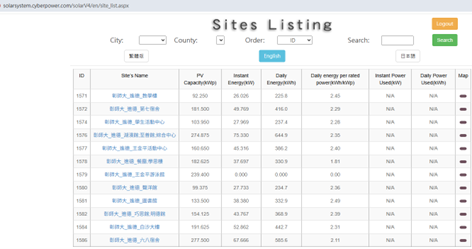
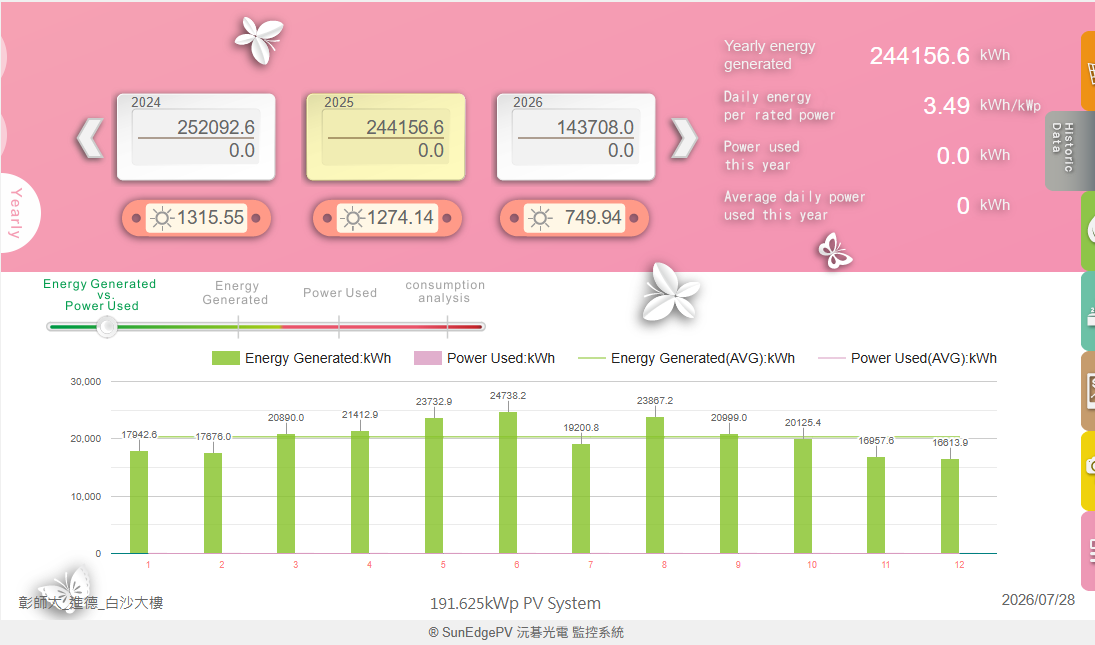
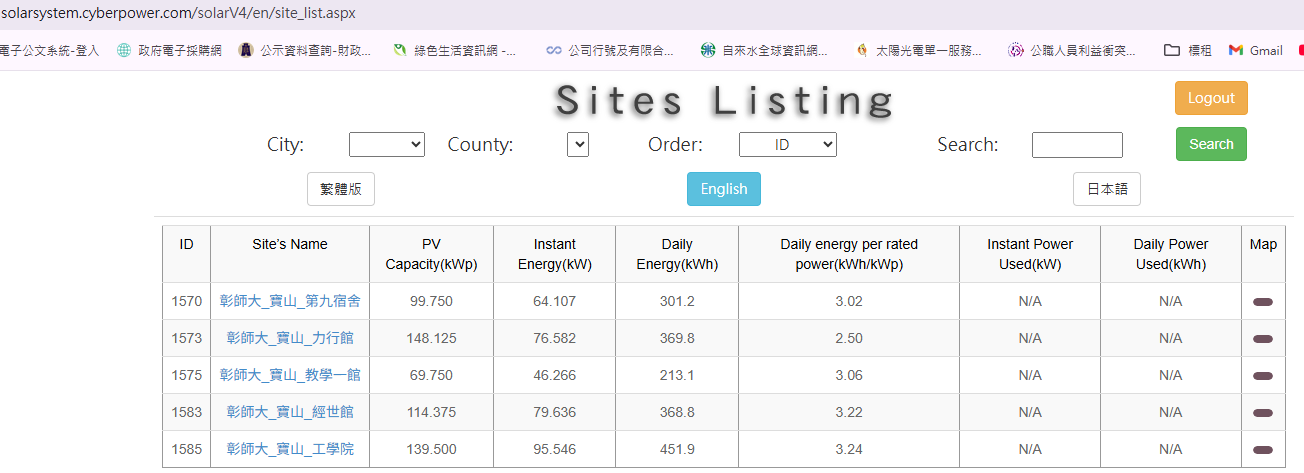
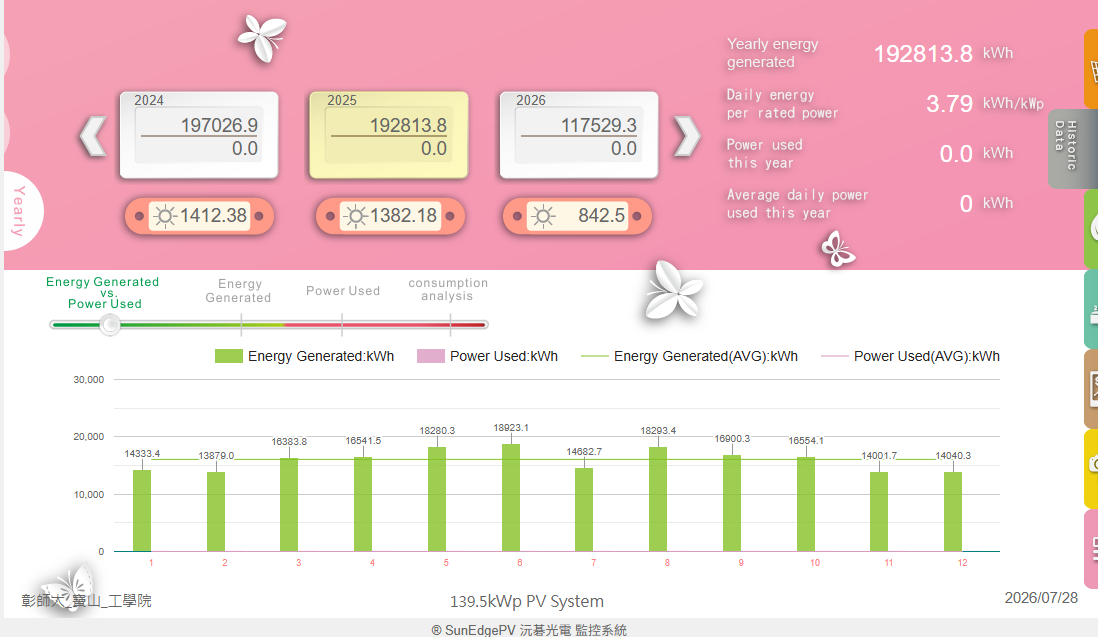
This system covers the solar power generation equipment on major buildings at Jinde Campus and Shida Campus. Users can query daily, monthly, and annual generation data and generate statistical reports. Figures 3-6 respectively show the site lists and annual power generation data screens for each location.