SDG 6.2.1
SDG 6.2.1 Water consumption tracking
1. Campus Water Consumption
In 2025, NCUE used a total of 483,653 m3 of water: 128,825 m3 of tap water (26.64%) and 354,828 m3 of groundwater (73.36%), as shown in Table 1.
| Water consumption (2025) | Tap water (m3) | Groundwater (m3) | Total (m3) |
|---|---|---|---|
| Jinde Campus | 51,081 | 289,819 | 340,900 |
| Shida Campus | 77,744 | 65,009 | 142,753 |
| Entire University | 128,825 | 354,828 | 483,653 |
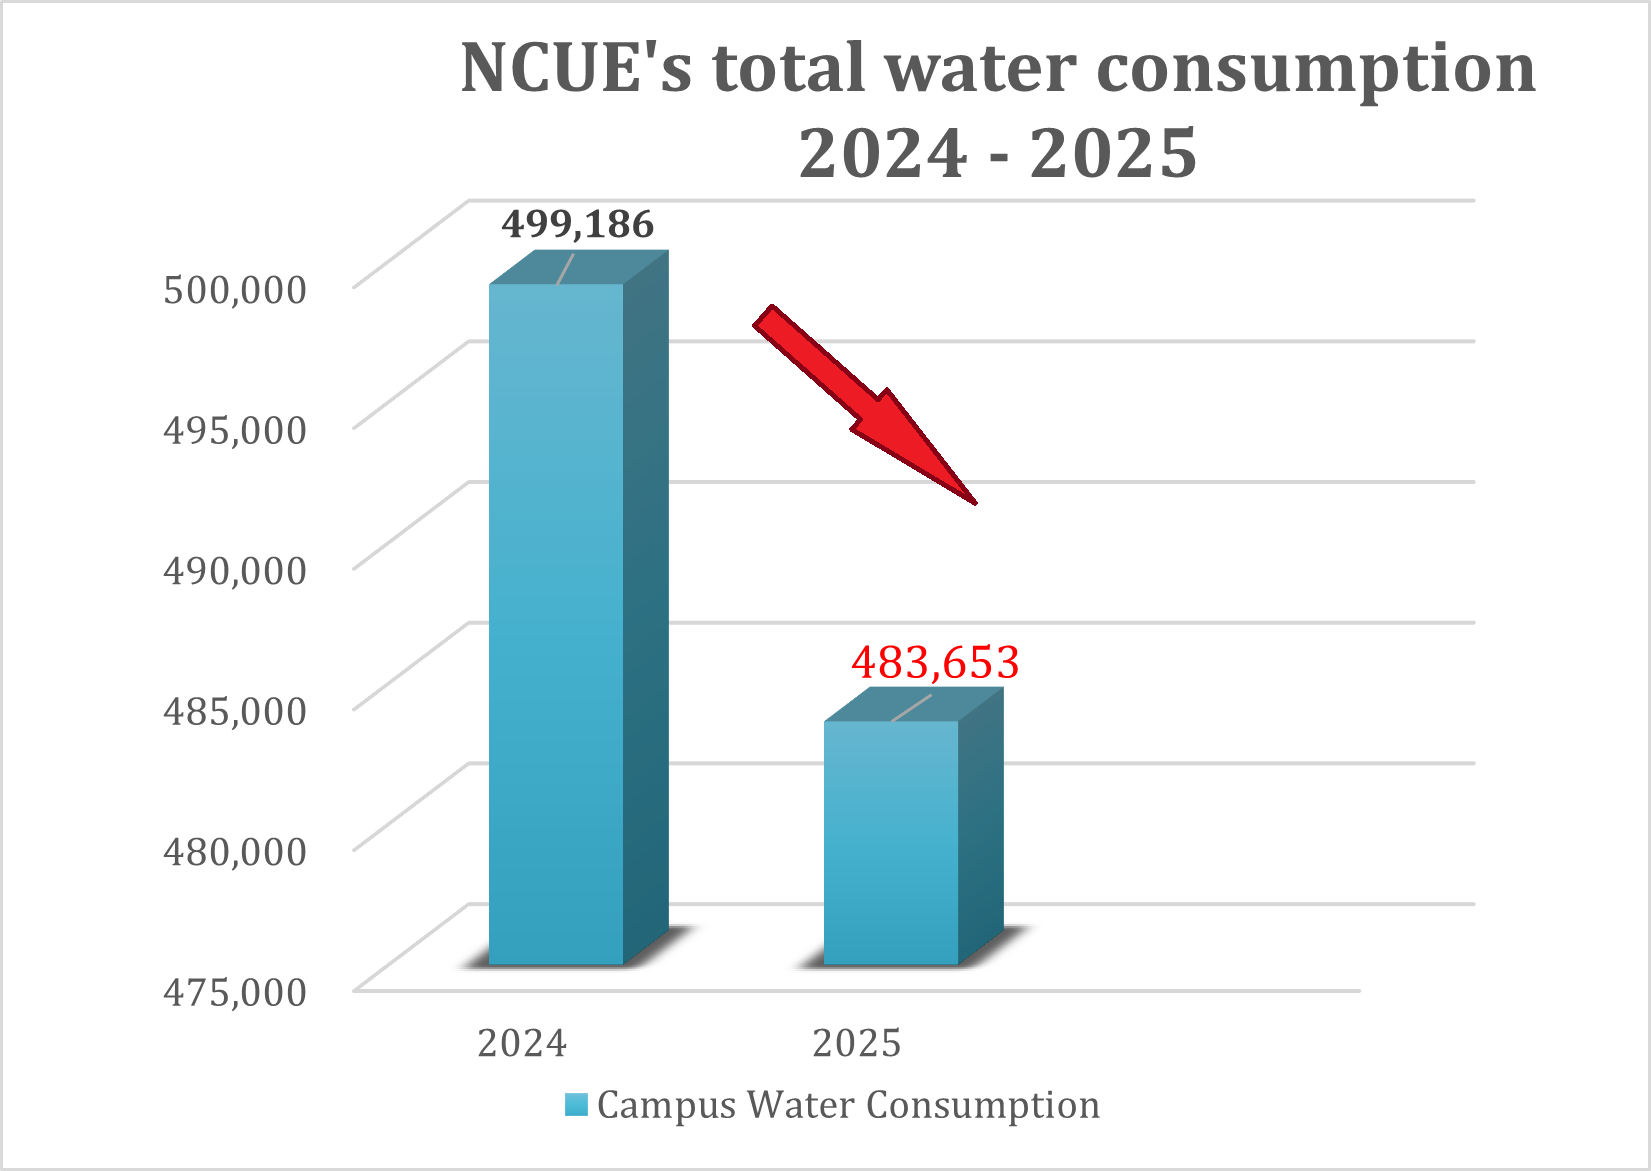
2. NCUE’s total water consumption from 2024 to 2025 shows a downward trend, as illustrated in Figure 1.
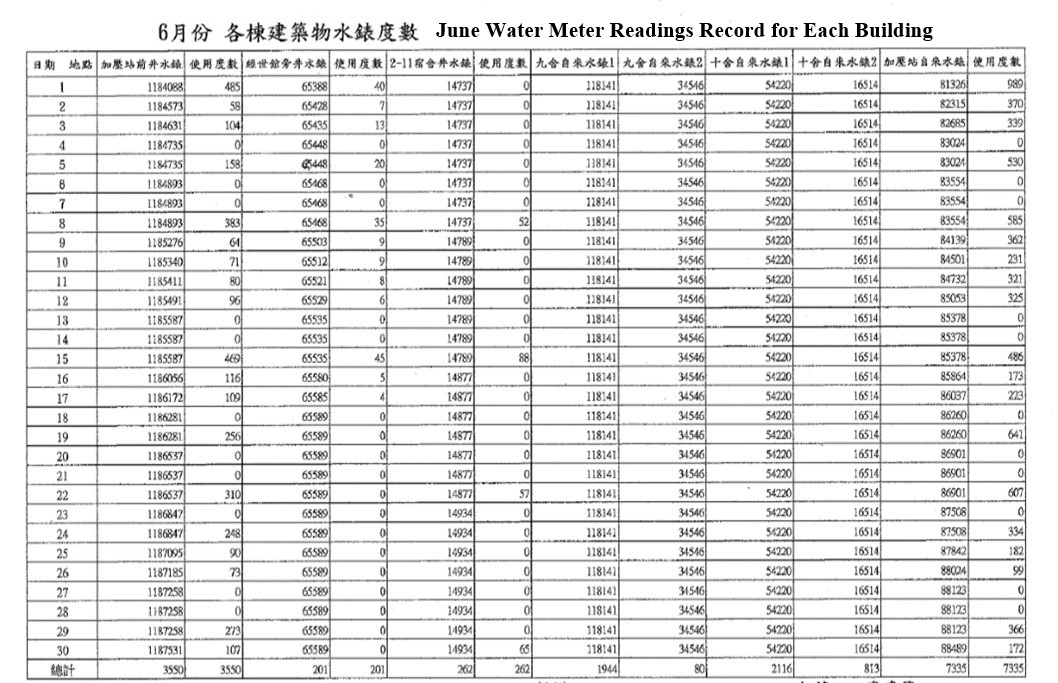
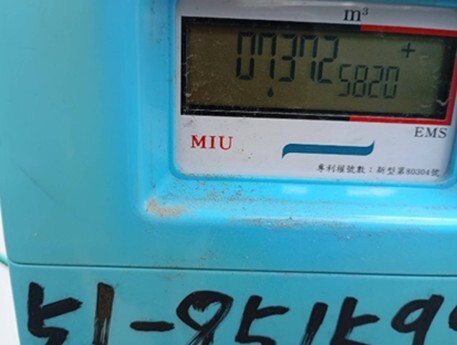
3. NCUE’s electricians read and record the water meters daily, as shown in Figures 2 and 3.
4. Smart Water Meter Installation and Enhanced Water Management
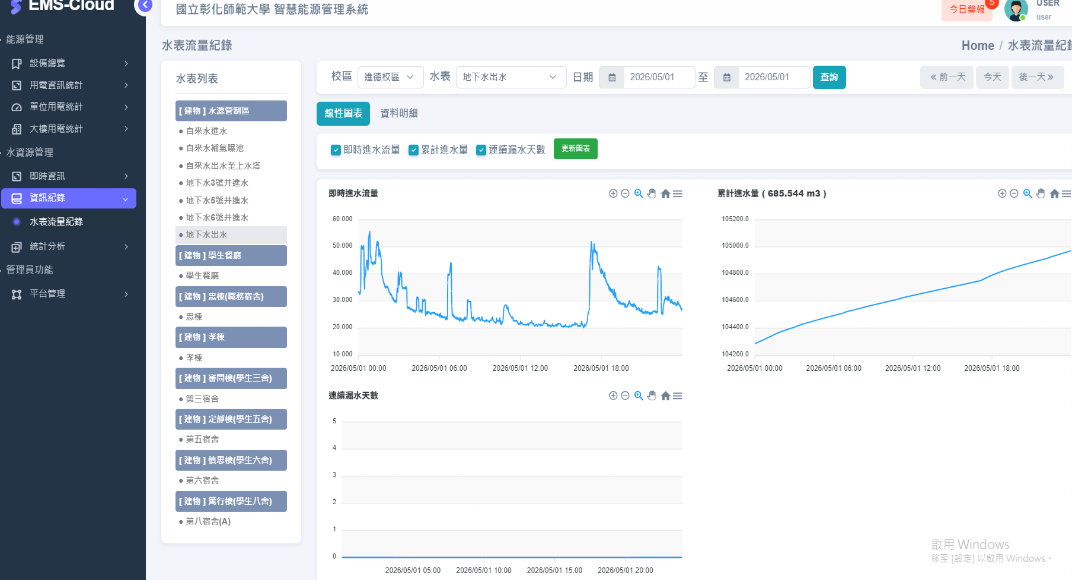
By the end of 2025, NCUE had installed 7 ultrasonic smart water meters on Jinde Campus (15 meters in total) and 23 new ultrasonic smart water meters on Shida Campus. Also, every building on Shida Campus has its own groundwater and tap water meters to monitor its water use. NCUE analyzes the consumption and event data that the smart meters transmit wirelessly to assess water use, and the management system automatically plots flow trend charts that can be used to detect abnormal usage. Real-time data from the smart meters allow NCUE to manage campus water use effectively and monitor water resources. With smart meters installed across its campuses, NCUE consolidates all types of water resource data as a basis for water balancing, allocation, leak detection, and management.
Figure 4 shows the interface of NCUE’s campus-wide Energy Management System (EMS). Website: