SDG 7.3.1
SDG 7.3.1 Energy usage per sqm
Total energy used
NCUE's total energy consumption in 2025, which equals its total electricity consumption, was 12,552,651 kWh (45,189.54 GJ). Table 1 shows NCUE's total annual energy consumption from 2022 to 2025.
| Year | Total Energy Consumption (kWh) | Total Energy Consumption (GJ) |
|---|---|---|
| 2022 | 12,998,200 | 46,793.52 |
| 2023 | 12,742,189 | 45871.88 |
| 2024 | 13,265,887 | 47757.19 |
| 2025 | 12,552,651 | 45189.54 |
Note: Electricity consumption on the Jinde Campus rose in 2024 compared with 2023 mainly because of construction work in the underground parking lot from April to August, which required the prolonged use of large fans (25 HP × 3 and 40 HP × 1) and jet fans (1 HP × 84), as well as electricity for ground surface milling, increasing consumption by approximately 660,000 kWh. Additionally, NCUE's swimming pool was closed during the COVID pandemic in 2021 and 2022, and was not reopened until June 2023. The period from January 2024 to December 2024 marked the first full year of operation post-pandemic, with the use of high energy consumption equipment such as the swimming pool chiller and heat pump systems also contributing to the increased electricity consumption.
University floor space
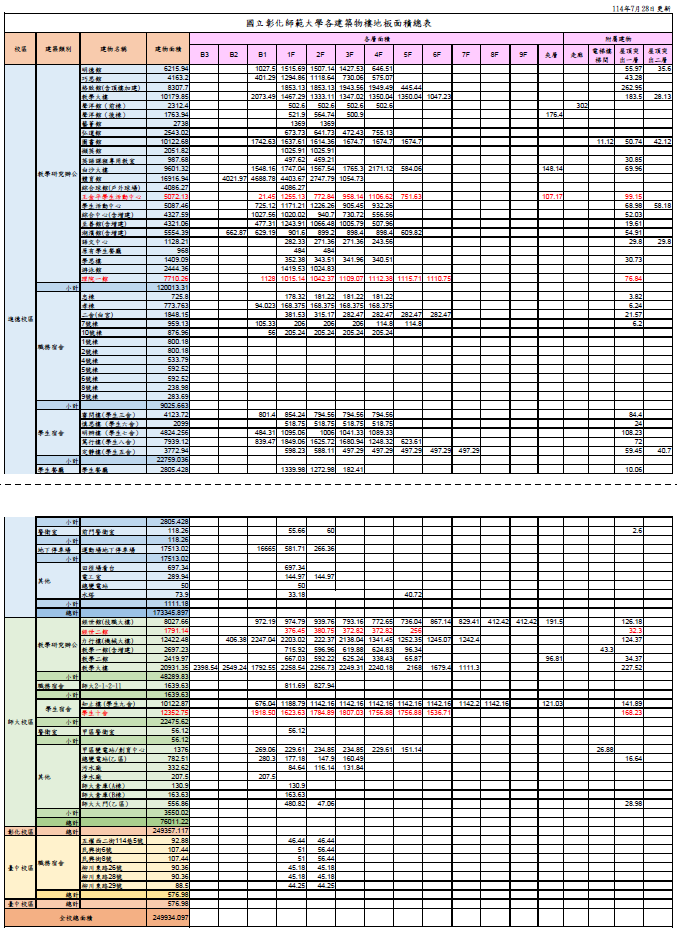
The total floor area of NCUE buildings in 2025 was 249934.097 m2, as shown in Figure 1:
Energy Consumption Density (Energy Consumption per Square Meter)
NCUE's energy consumption per square meter in 2025 = 45189.54/249934.097 =0.181 (GJ/m2)
Energy consumption per square meter statistics for 2022-2025 are shown in Table 2.
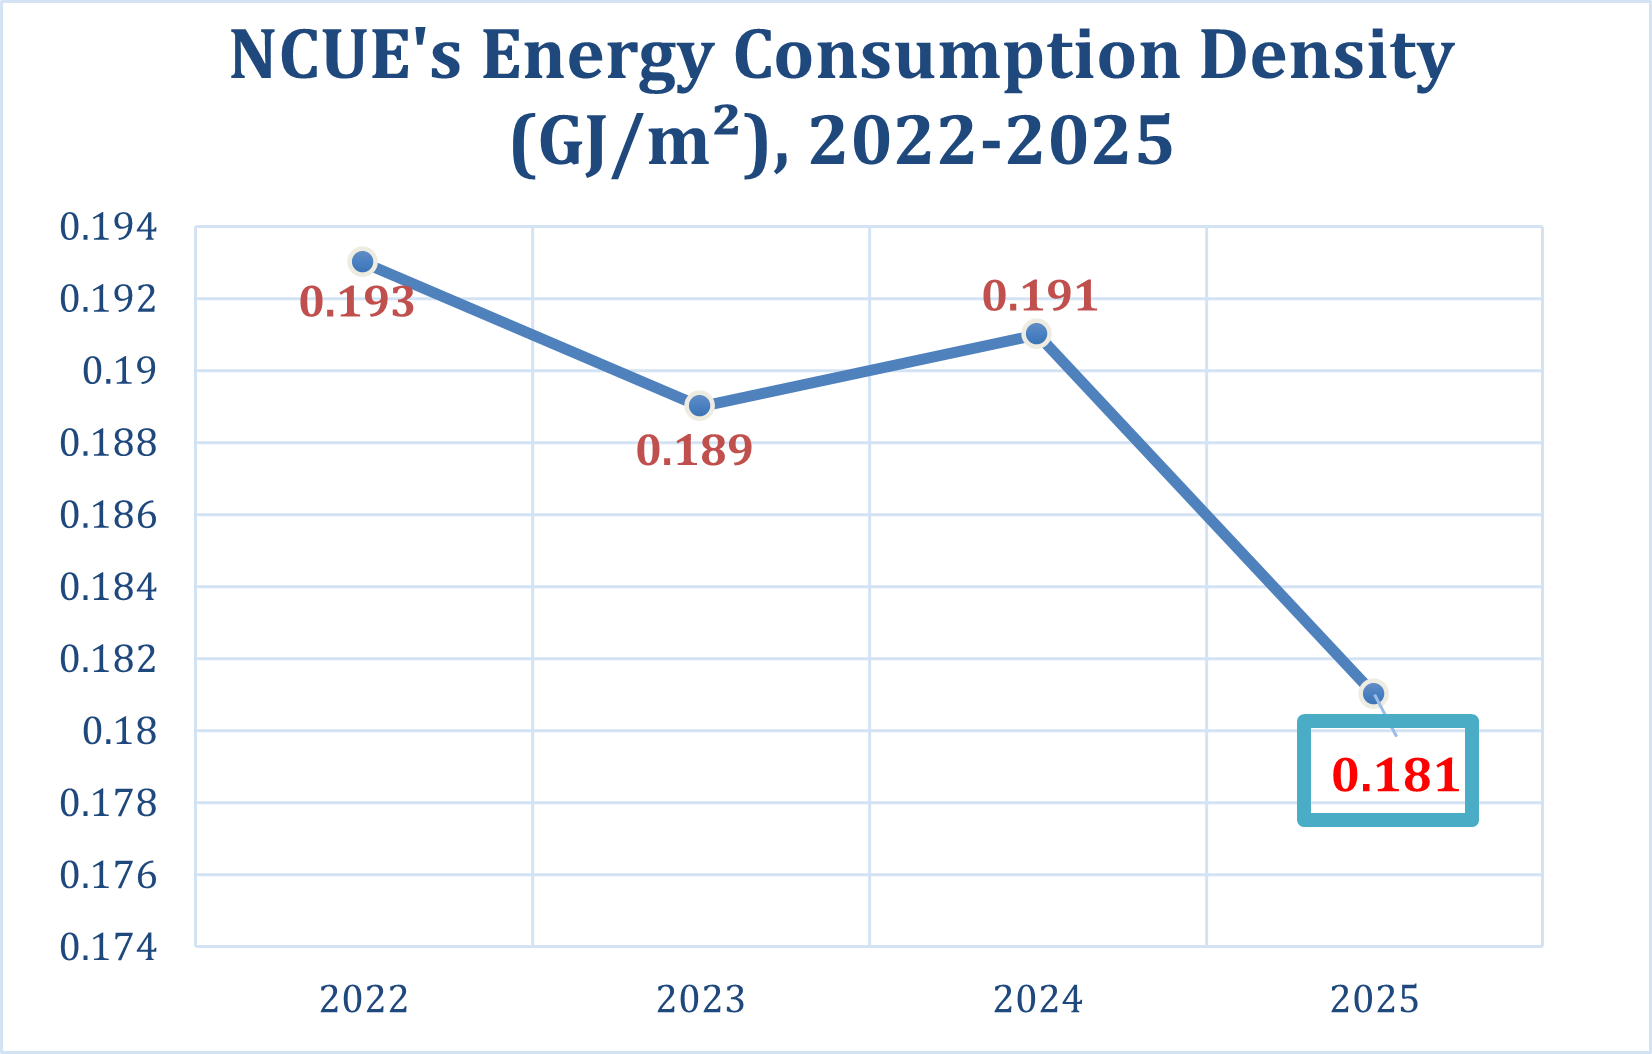
Figure 2 shows an overall downward trend in energy consumption density per square meter from 2022 to 2025.
| Year | Energy Consumption Density (GJ/m2) |
|---|---|
| 2022 | 0.193 |
| 2023 | 0.189 |
| 2024 | 0.191 |
| 2025 | 0.181 |