SDG 7.3.1 Energy usage per sqm
Total energy used
NCUE's total energy consumption, which is equivalent to the total electricity consumption in 2023, was 12,742,189 kWh = 45,871.88 GJ. The annual total energy consumption statistics from 2020 to 2023 are shown in Table 1.
Table 1. NCUE Total Energy Consumption Statistics 2020-2023
|
Year |
Total Energy Consumption (kWh) |
Total Energy Consumption (GJ) |
|
2020 |
13,541,300 |
48748.29 |
|
2021 |
12,350,600 |
44462.16 |
|
2022 |
12,998,200 |
46756.12 |
|
2023 |
12,742,189 |
45871.88 |
University floor space
1. The total floor area of NCUE buildings in 2023 was 242,212.717 m2, as shown in Figure 1:
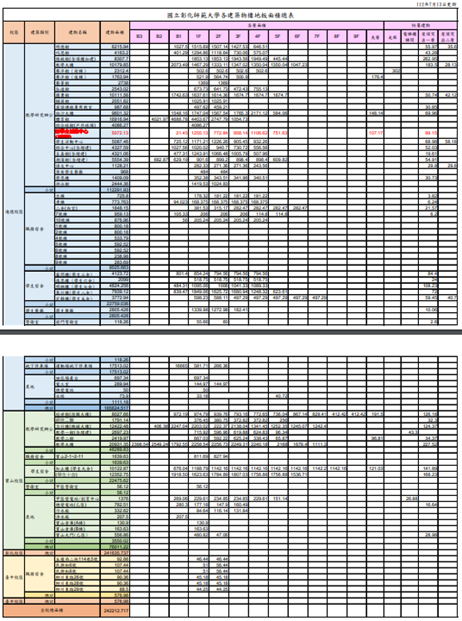
Figure 1. Total Floor Area of NCUE Buildings in 2023 (square meters)
Reference source:https://generalweb.ncue.edu.tw/var/file/4/1004/img/134/275458487.pdf
2. Energy Consumption Density (Energy Consumption per Square Meter)
NCUE's energy consumption per square meter in 2023 = 45,871.88 / 242,212.717 = 0.189 (GJ/m2). Energy consumption per square meter statistics for 2020-2023 are shown in Table 2.
Table 2. NCUE Energy Consumption per Square Meter Statistics 2020-2023
|
Year |
Energy Consumption Density (GJ/m2) |
|
2020 |
0.202 |
|
2021 |
0.184 |
|
2022 |
0.193 |
|
2023 |
0.189 |
3. The trend of electricity consumption from 2007 to 2023 shows a downward trend, as illustrated in Figure 2.
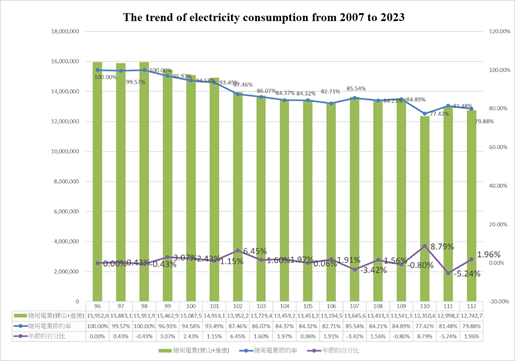
Figure 2. The downward trend in electricity consumption from 2007 to 2023


