
|
|

|

|

|

|
|

|

|
|
|
|
|
|
|

|
|
SDG 13.2.2 Low-carbon energy use
Total energy used
On NCUE’s Jinde Campus, the total electricity consumption for 2024 was 8,988,411 kWh, while on the Baoshan Campus, the total electricity consumption for 2024 was 4,277,476 kWh. The total electricity consumption for the entire University in 2024 was 13,265,887 kWh, equivalent to 47757.19 GJ.
Total energy used from low-carbon sources
1. In 2017, Jinde Campus installed a photovoltaic solar power system that generated 467kwp of power, with an average annual power generation of 583,750 kWh (2101.5GJ), accounting for 4.4% of the total power consumption of the University in 2024.
2. From 2021-2022, NCUE's Jinde Campus increased solar power annual generation to 3,197,968 kWh (11,512 GJ), and Baoshan Campus increased to 714,375 kWh (2,572 GJ), accounting for 29.44% of the university's total electricity consumption in 2024. (as detailed in Table 1)
3. NCUE is currently planning for 2026-2030, with Jinde Campus expected to further increase solar power annual generation to 3,478,433 kWh (12,522 GJ), and Baoshan Campus expected to increase to 1,636,875 kWh (5,893 GJ).
4. It is estimated that by 2030, NCUE's total solar power generation will reach 5,115,308 kWh (18,415GJ), exceeding 38% of the university's total electricity consumption in 2024, as detailed in Table 1. Table 1 presents NCUE's 2021-2030 Total Low-Carbon Energy Usage.
Table 1. NCUE's 2021-2030 Total Low-Carbon Energy Usage.
|
Campus |
Year |
Newly Added Capacity (kWp) |
Accumulated Capacity (kWp) |
Expected Power Generation (kWh) |
Percent of Total Power Consumption in 2024 |
|
Jinde |
Before 2020 |
467 |
467 |
583,750 |
7.04% |
|
2021-2022 |
2091.375 |
2558.375 |
3,197,968 |
38.57% |
|
|
2026~2030 |
230 |
2788.375 |
3,478,433 (12,522GJ) |
38.7% |
|
|
Baoshan |
Before 2020 |
0 |
0 |
0 |
0% |
|
2021-2022 |
571.5 |
571.5 |
714,375 |
15.87% |
|
|
2026~2030 |
738 |
1309.5 |
1,636,875 (5,893GJ) |
38.27% |
|
|
Total |
Before 2020 |
467 |
467 |
583,750 |
4.56% |
|
2021-2022 |
2657.25 |
3124.25 |
3,912,343 |
30.53% |
|
|
2026~2030 |
968 |
4097.875 |
5,115,308 (18,415GJ) |
38.56% |
5. NCUE is striving for carbon neutrality. Prior to 2020, during peak hours, solar energy generated on Jinde campus was 467 kw, and low-carbon energy accounted for approximately 15.57% of total power consumption (3,000 kW); whereas Baoshan campus consumed 1,000 kw, which was not from low-carbon sources.
6. It was expected that in academic year 2021–2022, total solar energy generated on Jinde Campus would increase to 2558.375 kw during peak hours, whereas power consumption will reduce to 2,600 kw, which would push low-carbon energy sources to 98.18% of the total energy consumed. On Baoshan Campus, solar power generation was expected to increase to 571.5 kw during peak hours, whereas power consumption was expected to reduce to 900 kw, increasing low-carbon energy sources to 63.5% of the total power consumed.
7. In 2024, NCUE's Jinde Campus solar power peak generation reached 2558.375 kW, while peak electricity consumption was reduced to 2,200 kW, with low-carbon energy accounting for over 100%. Baoshan Campus peak generation reached 571.5 kW, with peak electricity consumption reduced to 785 kW, achieving a low-carbon energy ratio exceeding 72.8%, as detailed in Table 2. Table 2 presents NCUE's 2021-2030 Total Planned New Solar Power Installation Capacity.
Table 2. NCUE's 2021-2030 Total Planned New Solar Power Installation Capacity
|
Campus |
Year |
Solar Energy Generated during Peak Hours (kW) |
Power Consumption during Peak Hours (kW) |
Proportion of Solar Power to Power Consumption |
|
Jinde |
Before 2020 |
467 |
3000 |
15.57% |
|
2021-2022 |
2558.375 |
2600 |
98.18% |
|
|
2026~2030 |
2788.375 |
2200 |
>100% |
|
|
Baoshan |
Before 2020 |
0 |
1000 |
0% |
|
2021-2022 |
571.5 |
900 |
63.5% |
|
|
2026~2030 |
1309.5 |
785 |
>100% |
(1) The solar power generation device installation table for NCUE's Jinde and Baoshan campuses in 2022 (categorized by building) is shown in Table 3.
Table 3. Solar Power Generation Device Installation Table for NCUE's Jinde and Baoshan Campuses in 2022
|
Campus |
Building |
Estimated capacity (kWp) |
Estimated power generation (kwh/year) |
|
Jinde Campus |
Qiaosi Building |
69 |
94,687 |
|
Baisha Building |
191.625 |
239,531 |
|
|
Zhishan Building |
48 |
60,000 |
|
|
Mingde Building |
85.125 |
80,156 |
|
|
Educational Building |
92.25 |
115,312 |
|
|
No. 8 Dormitory |
189 |
236,250 |
|
|
No. 7 Dormitory |
181.5 |
226,875 |
|
|
No. 6 Dormitory |
88.5 |
110,625 |
|
|
Hubin Building |
123 |
153,750 |
|
|
Library |
133.5 |
183,281 |
|
|
Comprehensive Center |
103.875 |
129,843 |
|
|
Student Canteen |
146.625 |
183,281 |
|
|
Shengyang Building |
99.375 |
124,218 |
|
|
Xuesi Building |
36 |
45,000 |
|
|
Wang, Jin-Pyng Activity Center |
160.65 |
192,187 |
|
|
Wang, Jin-Pyng Swimming Pool |
239.4 |
302,812 |
|
|
Old Activity Center |
103.5 |
129,375 |
|
|
Jinde Campus Total |
2091.375 |
2,607,183 |
|
|
Baoshan Campus |
No. 9 Dormitory |
99.75 |
125,625 |
|
First Educational Building |
69.75 |
126,563 |
|
|
College of Engineering Building |
139.5 |
174,375 |
|
|
Jingshi Building |
114.375 |
142,969 |
|
|
Lixing Building |
148.125 |
185,156 |
|
|
Baoshan Campus Total |
571.5 |
714,375 |
|
(2) NCUE accesses solar power generation information through real-time solar monitoring systems to effectively manage and track solar power generation efficiency. NCUE's solar monitoring system interface is shown in Figure 1.
System website: http://solarsystem.cyberpower.com/solarV4/id_login.aspx
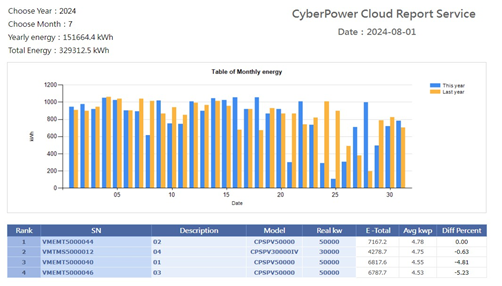
Figure 1: Solar Energy Monitoring System of NCUE
(3) The proportion of solar power consumption during peak hours at NCUE's Jinde and Baoshan campuses in 2024 is shown in Figures 2-3.
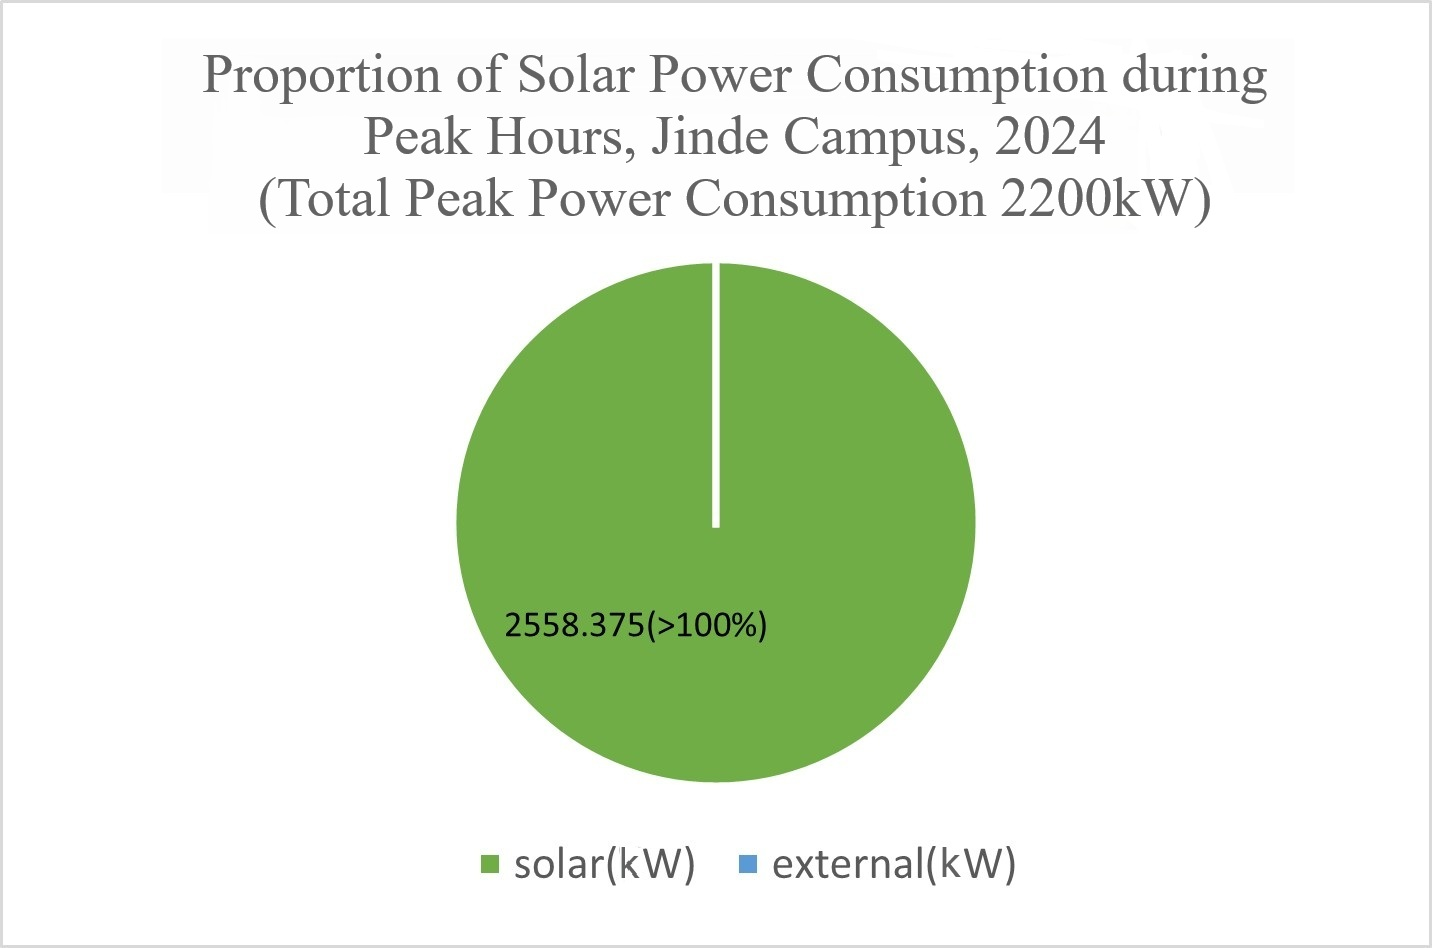
Figure 2: Proportion of Solar Power Consumption during Peak Hours, Jinde Campus, 2024
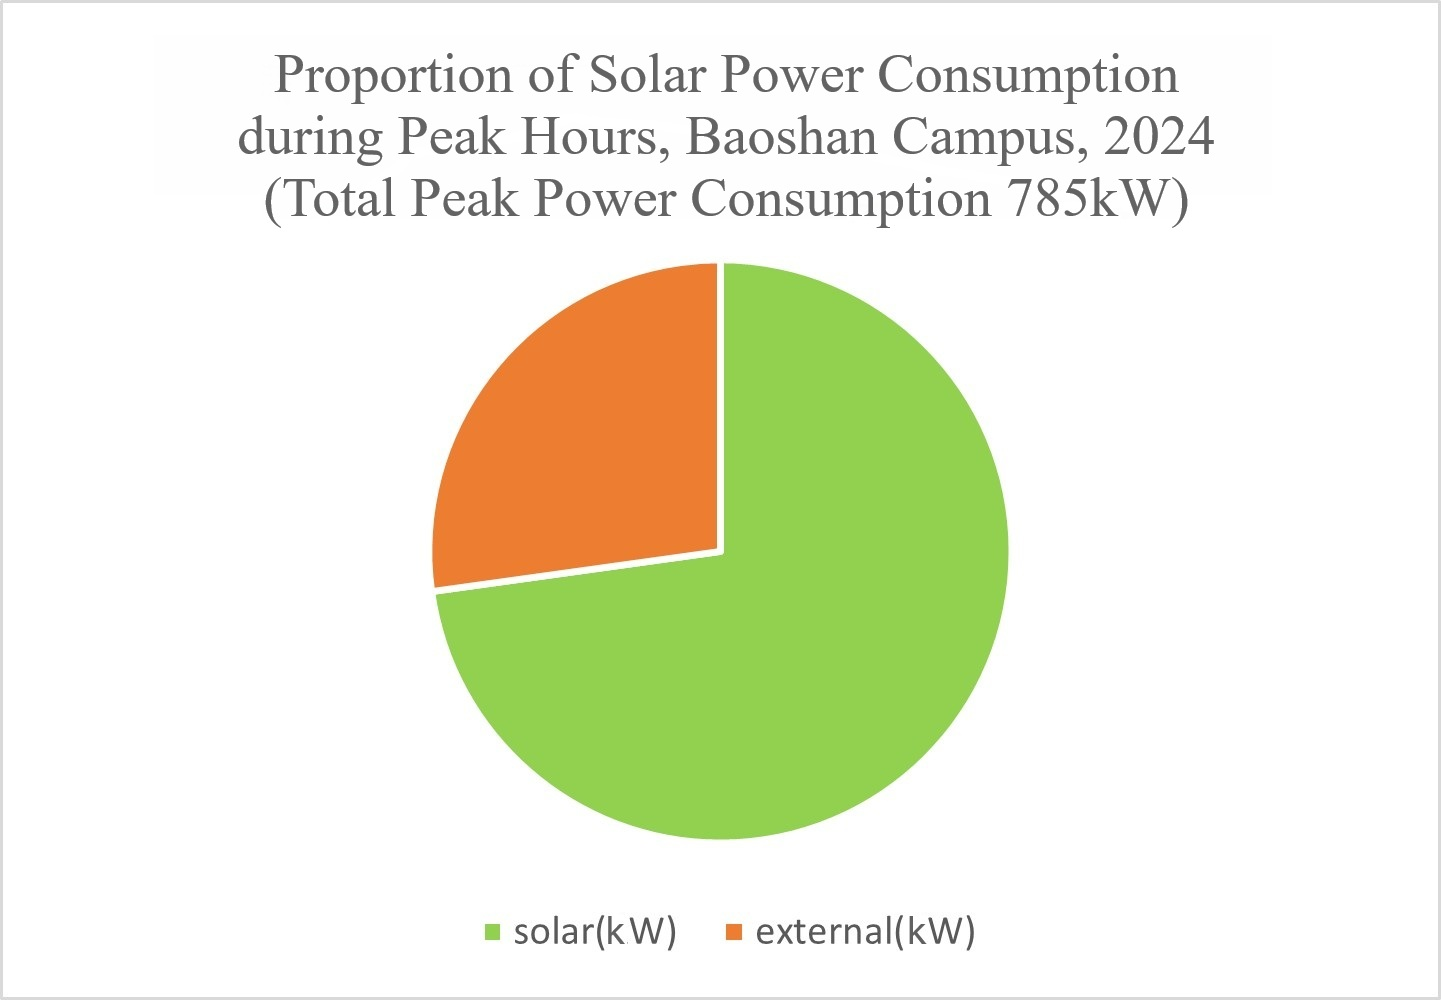
Figure 3: Proportion of Solar Power Consumption during Peak Hours, Baoshan Campus, 2024
(4) NCUE is currently planning new rooftop and ground-mounted photovoltaic solar devices for 2026-2030. Jinde Campus is expected to add 230 kWp, and Baoshan Campus is expected to add 738 kWp. The planned solar power generation device installation table for 2026-2030 is shown in Table 4.
For NCUE's complete 2026-2030 solar power planning and design concept diagram, please refer to Annex 13.2.2A(PDF) - 2026-2030 Planned Expansion of Photovoltaic Solar Device Capacity
Table 4. NCUE's 2026-2030 Planned Solar Power Generation Device Installation Table
|
Campus |
Location |
Estimated Capacity (kWp) |
Estimated Power (kWh/year) |
|
Jinde Campus |
College of Science Buildings 1 & 2 |
230 |
287,500 |
|
Baoshan Campus |
Covered Court |
306 |
382,500 |
|
Volleyball Court |
204 |
255,000 |
|
|
Tennis Court |
228 |
285,000 |
|
|
Campus-wide (Total) |
968 |
1,210,000 |
|