

|
|

|

|

|
|
|
|

|
|
|
|
|
|
|

|
|
SDG 13.2.1 Low carbon energy tracking
1. NCUE's 2024 Low-Carbon Energy Usage Statistics
(1) NCUE is committed to promoting green campus construction and actively introducing low-carbon energy systems. The 2024 energy usage statistics are as follows:
(a) NCUE's total energy consumption in 2024, which is equivalent to the total electricity consumption, was 13,265,887 kWh = 47,757.19 GJ
(b) NCUE's low-carbon energy usage in 2024 amounted to 3,998,415 kWh = 14,394 GJ
(c) All low-carbon energy used by NCUE is entirely from photovoltaic solar systems installed on campus.
(2) Overview of Solar Power Generation Facilities
NCUE has installed photovoltaic solar systems at both Jinde and Baoshan campuses:
(a) Jinde Campus installed capacity: 2,558.375 kWp
(b) Baoshan Campus installed capacity: 571.5 kWp
(c) Total installed capacity: 3,129.875 kWp
(3) Power Generation Calculation Basis
Based on the average daily sunlight duration of 3.5 hours in the Changhua region of Taiwan, the total solar power generation in 2024 was: (2,558.375 + 571.5) × 365 × 3.5 = 3,998,415 kWh = 14,394 GJ
2. NCUE's Low-Carbon Energy Usage Development Trend from 2022-2024
NCUE's low-carbon energy usage has continued to grow over the past three years, as detailed in Table 1.
Table 1: NCUE's Low-Carbon Energy Usage Statistics from 2022-2024
|
Year |
Low-Carbon Energy Usage (GJ) |
Total Energy Usage (GJ) |
Low-Carbon Energy Usage Ratio (%) |
|
2022 |
2101.5 |
46756.12 |
4.49% |
|
2023 |
8,586 |
45871.88 |
18.72% |
|
2024 |
14,394 |
47757.19 |
30.14% |
3. Low-Carbon Energy Development Performance
NCUE's low-carbon energy usage from 2022-2024 has grown from 2,101.5 GJ to 14,394 GJ, with the proportion increasing from 4.49% to 30.14%, showing a significant growth trend as illustrated in Figure 1. This demonstrates NCUE's continued expansion of solar power generation equipment, progressively increasing renewable energy self-sufficiency, and steadily advancing toward the low-carbon campus goal.
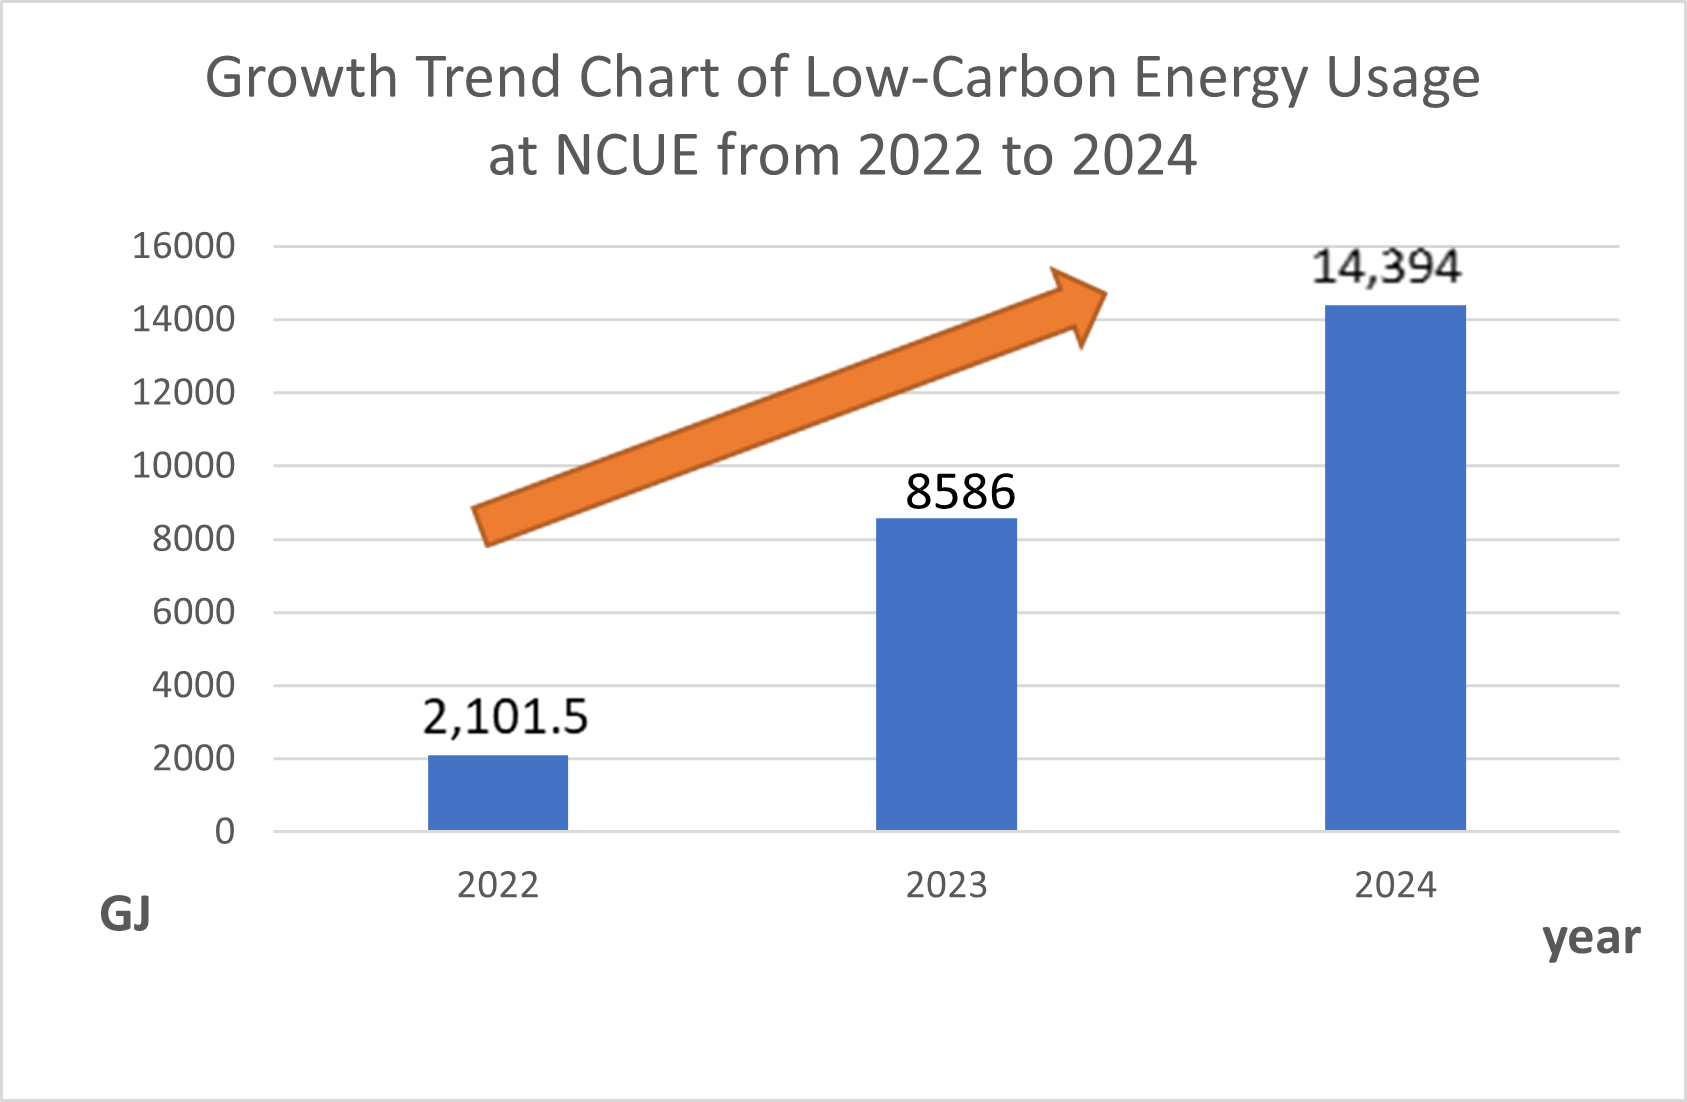
Figure 1. NCUE's Low-Carbon Energy Usage Shows an Increasing Trend from 2022-2024
4. Real-Time Monitoring and Data Transparency of Low-Carbon Energy
To effectively manage and track NCUE's solar power generation efficiency, NCUE accesses real-time power generation data, historical statistical information, and system operating status of photovoltaic equipment at all campuses through real-time monitoring systems, ensuring stable operation of solar equipment and maximizing power generation benefits.
(1) NCUE Gymnasium Solar Power Real-Time Monitoring System
System website: https://tatungolarweb.azurewebsites.net/tv/5000011/
This system specifically monitors the rooftop solar power generation equipment of the gymnasium, providing key data such as real-time generation power, cumulative power generation, and system efficiency to help management personnel monitor equipment operation status in real-time.
(2) Other Building Solar Power Monitoring System in NCUE
System website: http://solarsystem.cyberpower.com/solarV4/id_login.aspx
This system covers the major building solar power generation equipment at NCUE's Jinde and Baoshan campuses, providing daily, monthly, and annual power generation data queries and statistical report generation functions.
Figures 2-5 respectively show the site lists and annual power generation data screens for each location. Please also refer to attachment: 13.2.1A(PDF) Building Solar Power Monitoring System Query Interface Diagram.
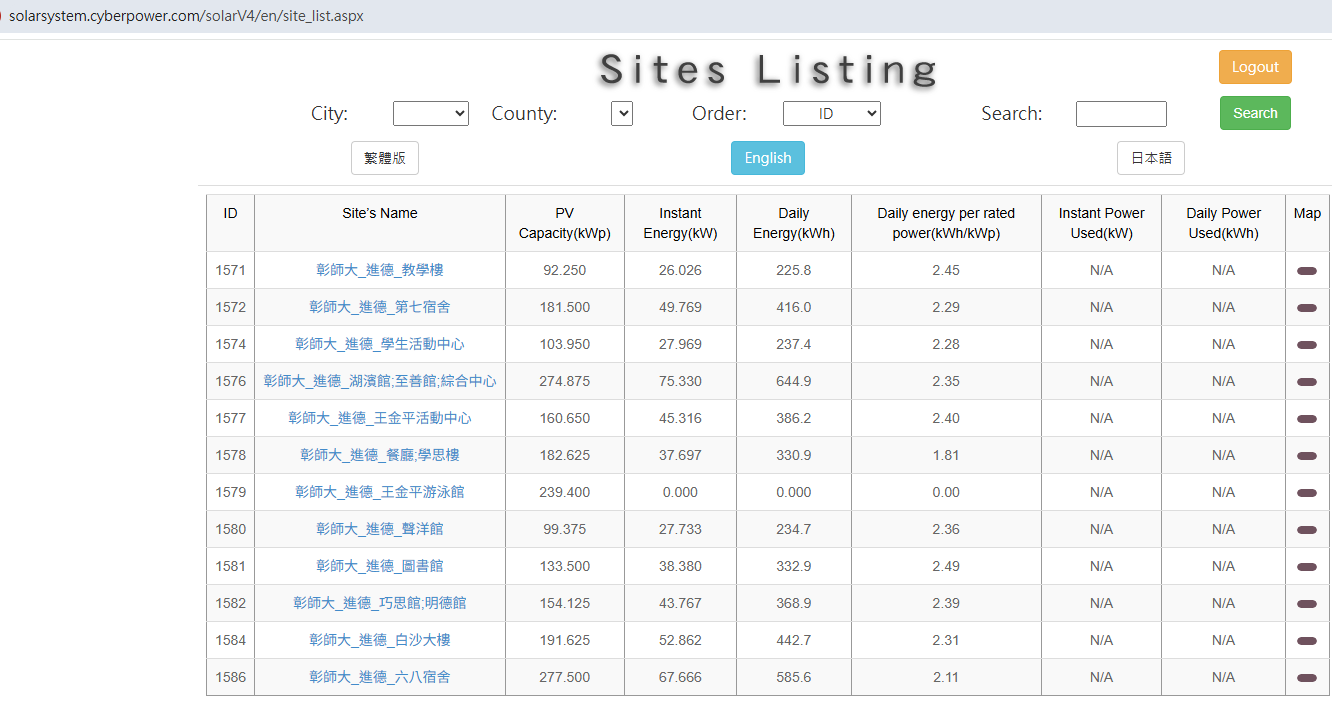
Figure 2. Building Solar Power Monitoring System Website Information - Jinde Campus Site List Management Interface
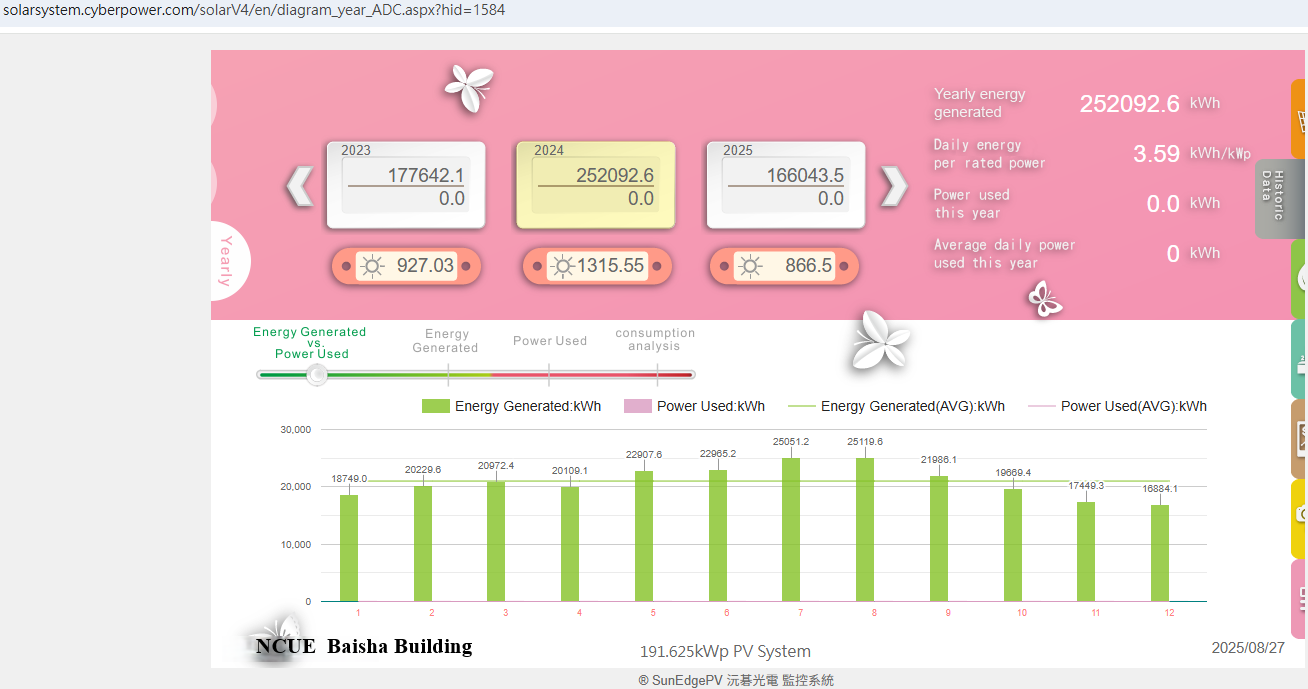
Figure 3. Jinde Campus Baisha Building 2024 Annual Power Generation Data Query Screen
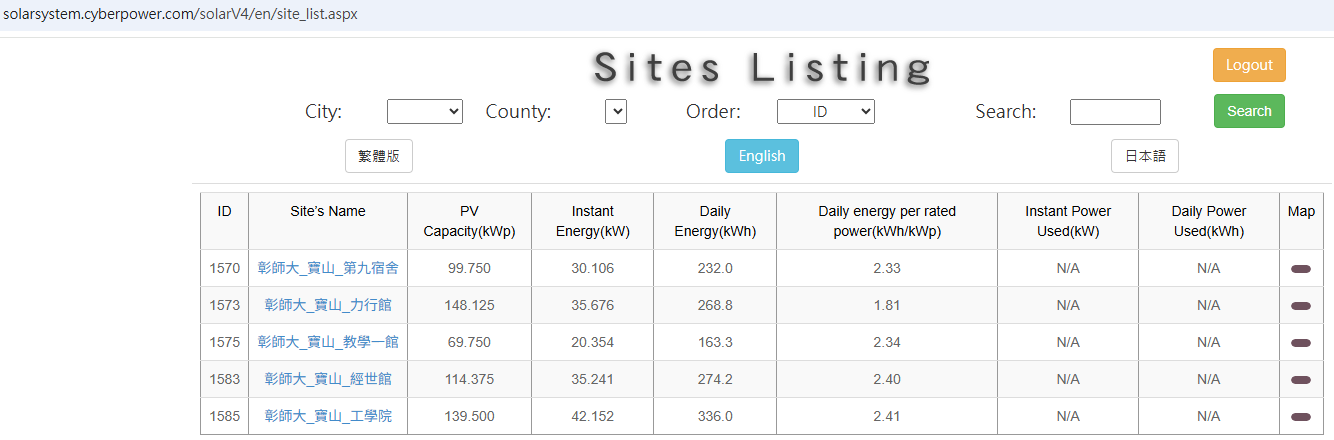
Figure 4. Building Solar Power Monitoring System Website Information - Baoshan Campus Site List Management Interface
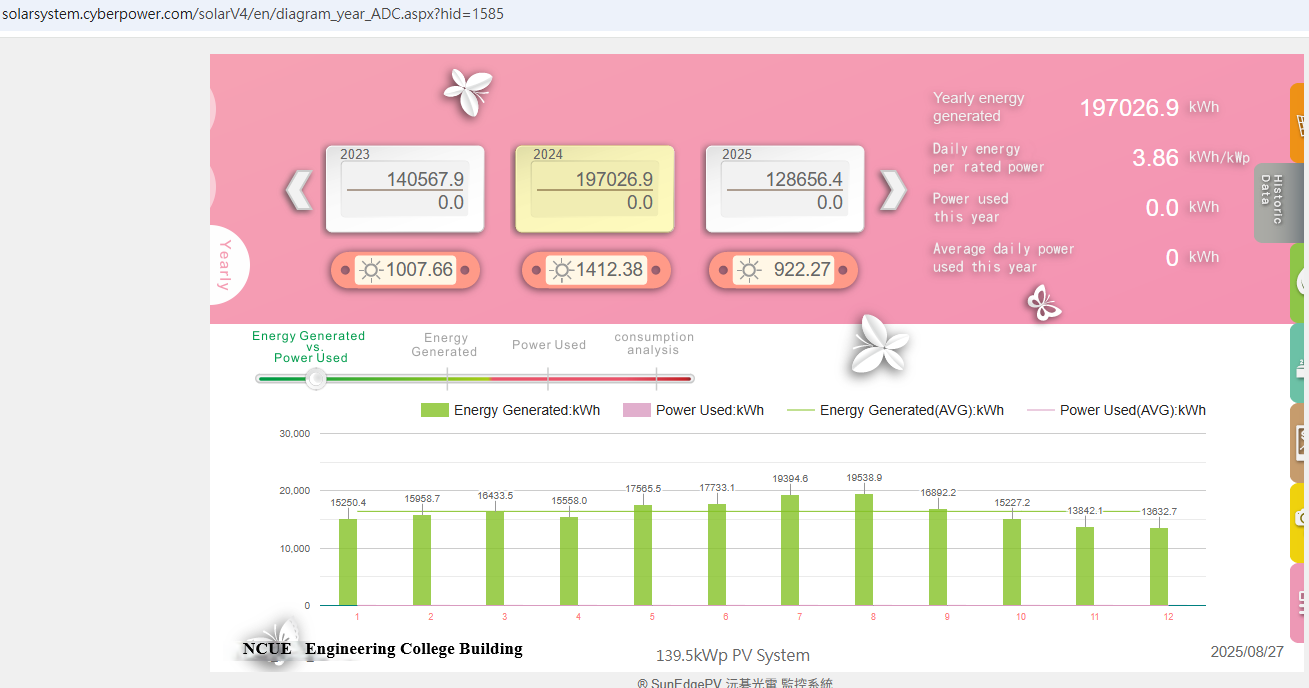
Figure 5. College of Engineering, Baoshan Campus 2024 Annual Power Generation Data Query Screen