

|

|

|

|

|

|

|

|

|

|

|

|

|
|

|

|

|
SDG 6.2.1 Water consumption tracking
1. Campus Water Consumption
In 2024, NCUE consumed a total of 499,186 m3 of water, comprising 153,517 m3 of tap water and 345,669 m3 of groundwater, respectively. Tap water and groundwater accounted for 30.75% and 69.25% of total water consumption, respectively as shown in Table 1.
Table 1. Total water consumption of tap water and groundwater in 2023
|
Water consumption (2024) |
Tap water (m3) |
Groundwater (m3) |
Total (m3) |
|
Jinde Campus |
77,774 |
317,464 |
395,238 |
|
Baoshan Campus |
75,743 |
28,205 |
103,948 |
|
Entire University |
153,517 |
345,669 |
499,186 |
2. NCUE's water consumption is recorded daily by the school’s electrical staff, who take meter readings, as shown in Figures 1 and 2. The total water consumption of NCUE in 2024 increased slightly because of a series of major earthquakes that caused pipeline leakage throughout the campus (as shown in Figures 3 and 4).
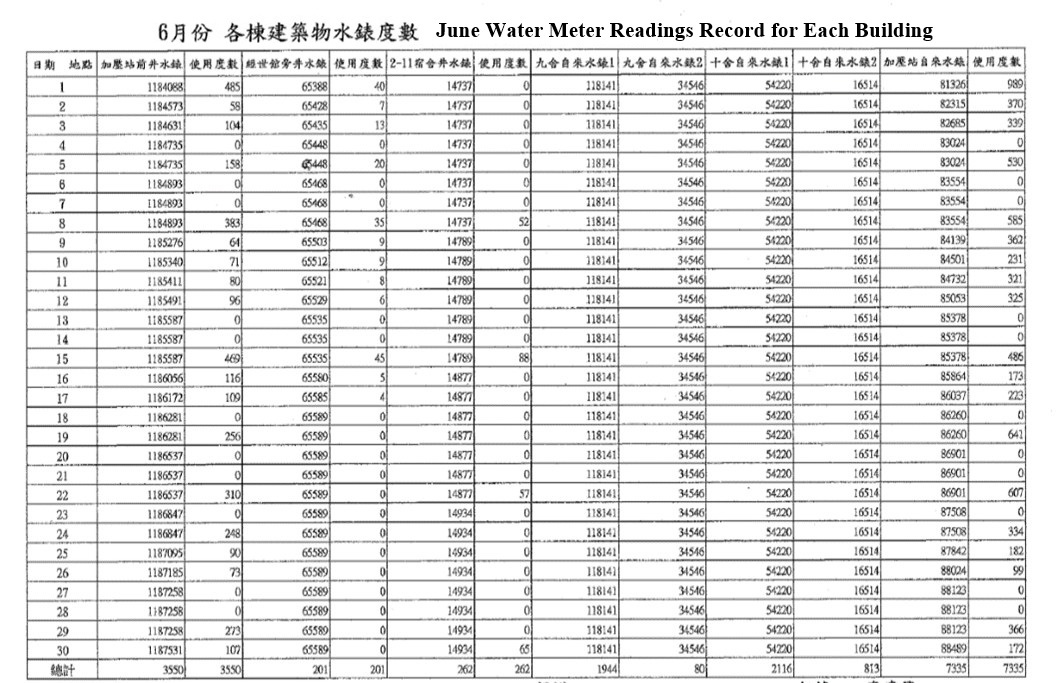
Figure 1. Daily meter reading records by NCUE’s electrical staff
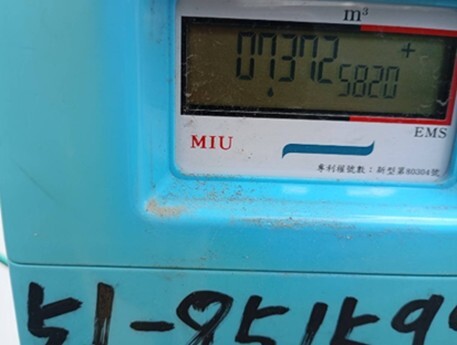
Figure 2: Schematic diagram of water meter reading points recorded daily by the university’s electrical staff
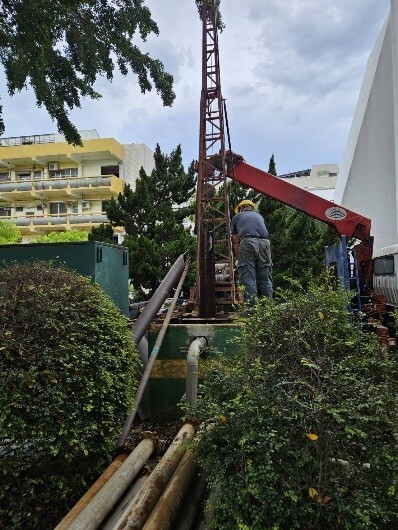
Figure 3. Workers were repairing the deep water well at Jinde Campus
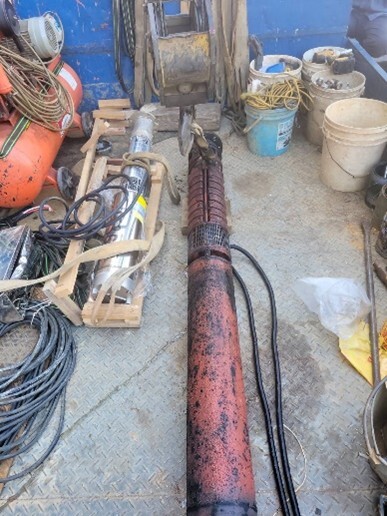
Figure 4. A deep water well motor to be repaired
3. Smart Water Meter Installation and Enhanced Water Management
NCUE plans to install 7 ultrasonic smart water meters on the Jinde Campus and add 23 new ultrasonic smart water meters on the Baoshan Campus by the end of 2025 (schematic diagram shown in Figure 5). On the Baoshan Campus, each building will be equipped with groundwater and tap water meters to monitor water usage data for each building. The university can evaluate the water usage patterns by analyzing the water consumption and event data wirelessly transmitted from smart water meters. The flow trend charts automatically generated by the management system can be used to detect abnormal water usage. Real-time data obtained from smart water meters enables effective management of on-campus water usage and provides instant water resource monitoring information. By installing smart water meters across the campus, NCUE can consolidate various water resource data throughout the campus to serve as a basis for water resource balancing, allocation, leak detection, and management.
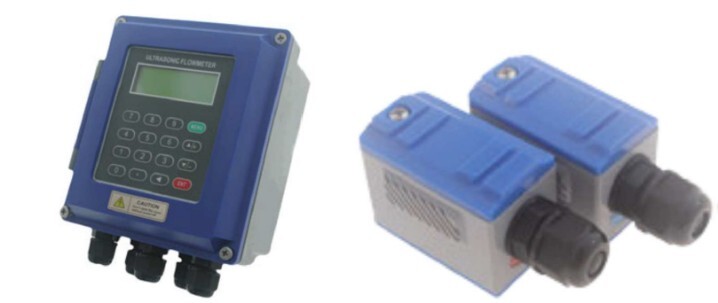
Figure 5. Smart water meter diagram