
|
|
|
|
|
|
|
|

|
|
|
|
|
|
|
|
|
SDG 5.5.1 Proportion of female degrees awarded
Number of graduates: Total
The number of students graduating from NCUE in 2023-2024: 1,156 in the bachelor's degree, 902 in the master's degree, 81 in the doctoral degree, and a total of 2,139. Please refer to Figure 1.
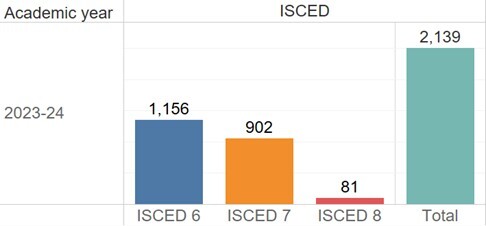
Figure 1: Numbers of students who graduated
Number of graduates by subject area (STEM, Medicine, Arts & Humanities / Social Sciences): Total
In 2024, the total number of graduates by academic field—STEM, Medicine, and Arts/Humanities & Social Sciences—was 2,139 (see Figure 2).
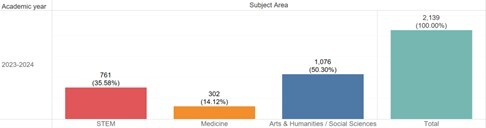
Figure 2: The number of graduates by academic field (STEM, Medicine, Arts and Humanities/Social Sciences) in 2024
Each academic field is defined as follows:
Medicine: Guidance counseling, special education, rehabilitation counseling, sports, and sports and fitness.
STEM: Graduates of science and technology degrees other than the aforementioned.
Arts and Humanities/Social Sciences: Graduates of degrees other than the aforementioned.
Number of graduates: STEM
STEM: 761 graduates in 2024, as shown in Figure 3.
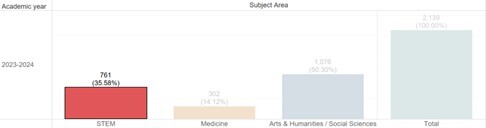
Figure 3: The number of graduates by academic field (STEM)
Number of graduates: Medicine
Medicine: 302 graduates in 2024, as shown in Figure 4.
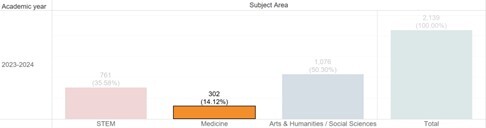
Figure 4: The number of graduates in Medicine field
Number of graduates: Arts & Humanities / Social Sciences
Arts & Humanities / Social Sciences: 1,076 graduates in 2024, as shown in Figure 5.
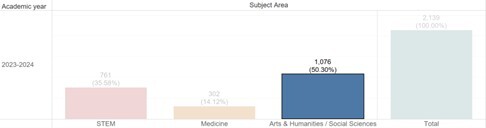
Figure 5: The number of graduates in Arts and Humanities/Social Sciences field
Number of female graduates by subject area (STEM, Medicine, Arts & Humanities / Social Sciences): Total
Number of female graduates by subject area (STEM, Medicine, Arts & Humanities / Social Sciences): 1,045 (48.85%) graduates in 2024, an increase of 72 people (0.94%) compared to 973 people in 2023 (47.91% of the total), as shown in Figure 6.
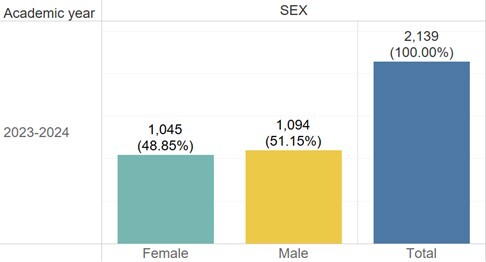
Figure 6: The number of female graduates by academic field (STEM, Medicine, Arts and Humanities/Social Sciences)
Number of female graduates: STEM
STEM: 200 (26.28%) female graduates in 2024, an increase of 28 people (2.32%) compared to 172 people in 2023 (23.96% of the total), as shown in Figure 7.
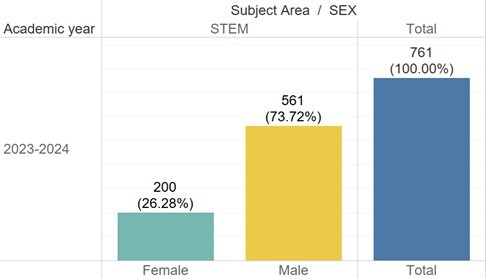
Figure 7: The total number of female graduates in the STEM field is 200
Number of female graduates: Medicine
Medicine: 202(66.89%) female graduates in 2024, an increase of 1 people (0.55%) compared to 201 people in 2023 (66.34% of the total), as shown in Figure 8.
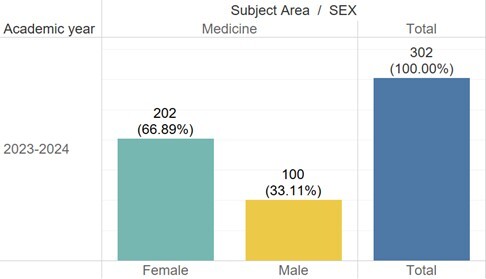
Figure 8: The number of female graduates in Medicine field
Number of female graduates: Arts & Humanities / Social Sciences
Arts & Humanities / Social Sciences: 643 (59.76%) graduates in 2024, An increase of 43 people (0.35%) compared to 600 people in 2023 (59.41% of the total), as shown in Figure 9.
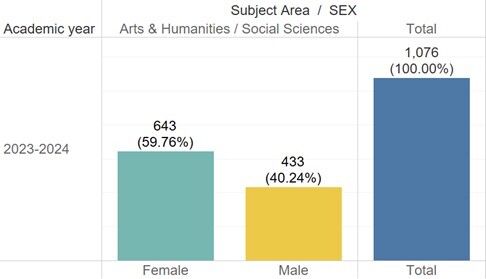
Figure 9: The number of female graduates by academic field (Arts and Humanities/Social Sciences)