SDG 6.2.2 Water consumption per person
Volume of water used in the university: Inbound (treated/ extracted water)
1. Campus Water Consumption
In 2023, NCUE consumed a total of 429,404m3 of water, comprising 127,492 m3 of tap water and 301,912 m3 of groundwater, respectively. Tap water and groundwater accounted for 29.7% and 70.3% of total water consumption, respectively as shown in Table 1.
Table 1. Total water consumption of tap water and groundwater in 2023
|
Water consumption (2023) |
Tap water ( m3) |
Groundwater ( m3) |
Total ( m3) |
|
Jinde Campus |
66,944 |
262,006 |
328,950 |
|
Baoshan Campus |
60,548 |
39,906 |
100,454 |
|
Entire University |
127,492 |
301,912 |
429,404 |
2. NCUE’s total water consumption from 2021 to 2023 shows a downward trend, as illustrated in Figure 1.
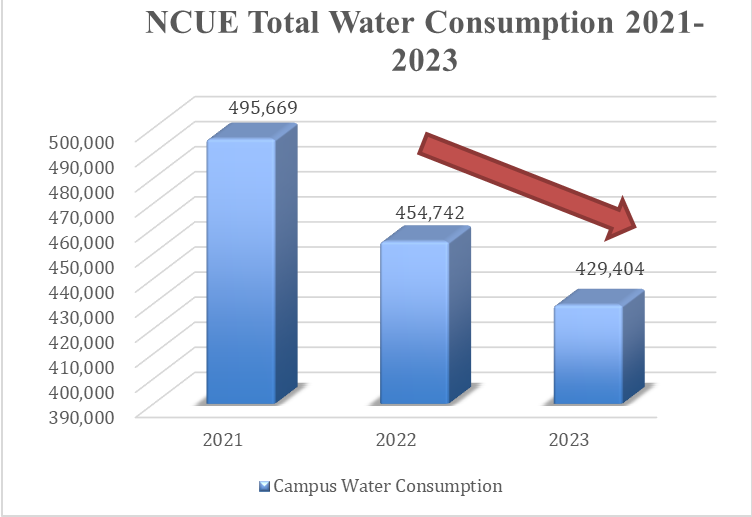
Figure 1: Downward trend in total water consumption at NCUE from 2021 to 2023
Campus population
1. Number of campus population
(1) Total number of students: 7,240
Data source: Appendix 6.2.2A 2023-1015-Student Population Statistics)
Statistical data webpage: https://acadaff.ncue.edu.tw/files/11-1021-2142.php?Lang=zh-tw
(2) Total number of employed staff (including project-based personnel): 815
Data source: Appendix 6.2.2B October 2023 Faculty and Staff Population Statistics
Statistical data webpage: https://personnelweb.ncue.edu.tw/p/405-1001-22763,c2452.php?Lang=zh-tw
(3) Total campus population: 8,055
2. Per capita water consumption:
(1) The average daily per capita water consumption of NCUE (both campuses) in 2023 was approximately 146 L. (429,404,000L /365 days/8,055 people=146L).
This was lower than the country’s average daily per capita water consumption of 289 L.
(2) NCUE’s daily per capita water consumption from 2021 to 2023 shows a downward trend, as illustrated in Figure 2.
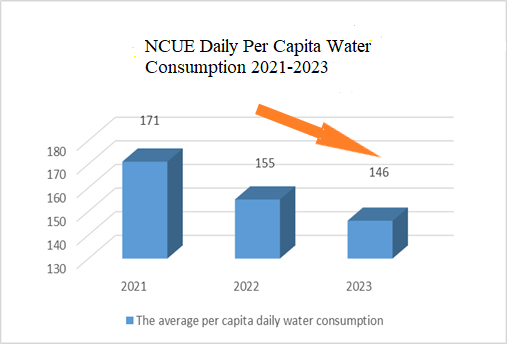
Figure 2: Downward trend in daily per capita water consumption at NCUE from 2021 to 2023


