
SDG 7.5.1 Low-carbon energy use
Total energy used
NCUE's 2024 Low-Carbon Energy Usage Statistics
1. NCUE is committed to advancing green campus construction and actively introducing low-carbon energy systems. The 2024 energy usage statistics are as follows:
(1) NCUE's total energy consumption in 2024, which is equivalent to the total electricity consumption, was 13,265,887 kWh = 47,757.19 GJ
(2) NCUE's low-carbon energy usage in 2024 amounted to 3,998,415 kWh = 14,394 GJ.
(3) All low-carbon energy used by NCUE is entirely from photovoltaic solar systems installed on campus.
2. Overview of Solar Power Generation Facilities
NCUE has installed photovoltaic solar systems at both Jinde and Baoshan campuses:
(1) Jinde Campus installed capacity: 2,558.375 kWp
(2) Baoshan Campus installed capacity: 571.5 kWp
(3) Total installed capacity: 3,129.875 kWp
3. Power Generation Calculation Basis
Based on the average daily sunlight duration of 3.5 hours in the Changhua region of Taiwan, the total solar power generation in 2024 was: (2,558.375 + 571.5) × 365 × 3.5 = 3,998,415 kWh = 14,394 GJ
Total energy used from low-carbon sources
1. NCUE's Low-Carbon Energy Usage Development Trend 2022-2024
(1) NCUE's low-carbon energy usage has continued to grow over the past three years, as detailed in Table 1.
Table 1: NCUE's Low-Carbon Energy Usage Statistics 2022-2024
|
Year |
Low-Carbon Energy Usage (GJ) |
Total Energy Usage (GJ) |
Low-Carbon Energy Usage Ratio (%) |
|
2022 |
2101.5 |
46756.12 |
4.49% |
|
2023 |
8,586 |
45871.88 |
18.72% |
|
2024 |
14,394 |
47757.19 |
30.13% |
(2) NCUE's low-carbon energy usage ratio rose from 18.72% in 2023 to 30.13% in 2024. The primary factors contributing to this increase are outlined below:
(a) Structural Increase Resulting from a Complete Annual Operating Cycle NCUE's solar power generation system was officially completed and connected to the grid in late May 2023.
i. 2023: Only power generation data from June to December were included, representing a partial year of operation.
ii. 2024: As the first full year of operation following system completion, the greater number of operational days resulted in a structural increase in total power generation, fully reflecting the system's designed capacity. This was the primary driver of the increase in total generation from 8,586 GJ to 14,394 GJ.
(b) Optimized System Performance Following the completion of the initial commissioning phase, the operational efficiency of the photovoltaic facilities stabilized in 2024. Combined with the Changhua region's stable sunlight conditions, this maximized the proportion of renewable energy self-sufficiency.
2. Low-Carbon Energy Development Performance
From 2022 to2024, NCUE’s low carbon energy usage increased from 2,101.5 GJ to 14,394 GJ, with its proportion of total energy use rising from 4.49% to 30.14%, as shown in Figure 1. This reflects NCUE's continuous expansion of solar power generation facilities, its growing renewable energy self-sufficiency, and steady progress toward achieving a low-carbon campu.
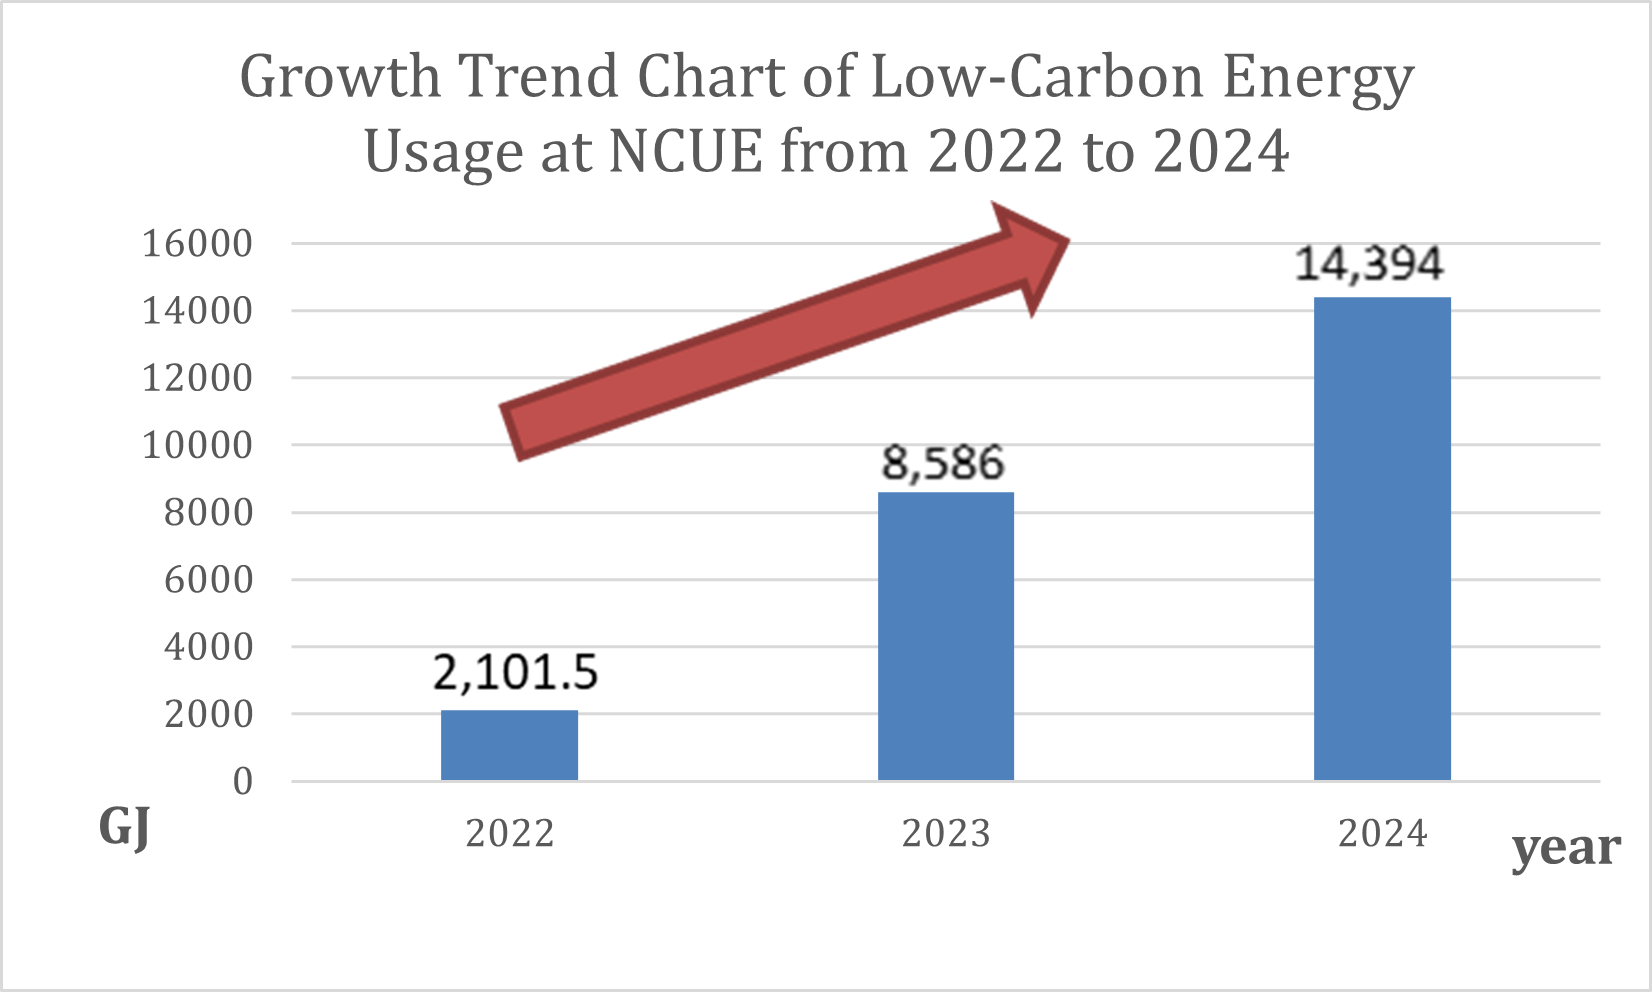
Figure 1. NCUE's Low-Carbon Energy Usage Shows an Increasing Trend from 2022-2024
3. In response to national policyrelevant government policies, NCUE completed the installation of photovoltaic solar systems on the rooftops of various campus buildings by the end of 2022. The solar power generation device installation table (as shown in Table 2) indicates installed capacity of 2091.375kWp at the Jinde Campus and 571.5kWp at the Baoshan Campus.
(1) NCUE Gymnasium Solar Power Real-Time Monitoring System.
System URL: https://tatungolarweb.azurewebsites.net/tv/5000011/
This system specifically monitors the rooftop solar power generation equipment of the gymnasium, providing key data such as current generation output, cumulative power generation, and system efficiency, along with daily, monthly, and annual power statistics and report generation functions. This enables management personnel to effectively monitor and analyze equipment performance real time.
(2) NCUE’s Solar Power Monitoring System in Other Campus Buildings.
System URL: http://solarsystem.cyberpower.com/solarV4/id_login.aspx
This system covers the major building solar power generation equipment at NCUE's Jinde and Baoshan campuses, providing daily, monthly, and annual power generation data queries and statistical report generation functions. Figures 2-5 respectively show the site lists and annual power generation data screens for each location. Please also refer to attachment: 7.5.1A(PDF) Query interface demonstration of NCUE’s Solar Power Monitoring System in Other Campus Buildings.
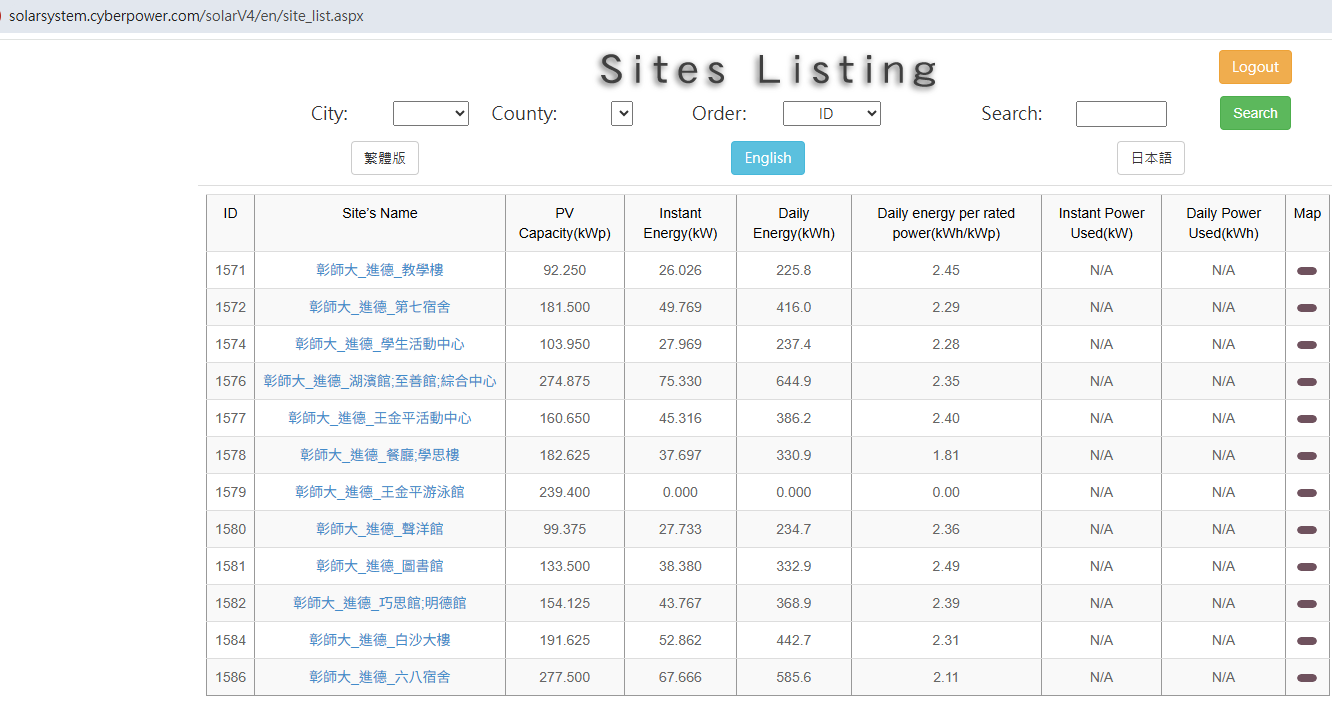
Figure 2. Solar Power Monitoring System in Other Campus Buildings Website - Jinde Campus Site List Management Interface
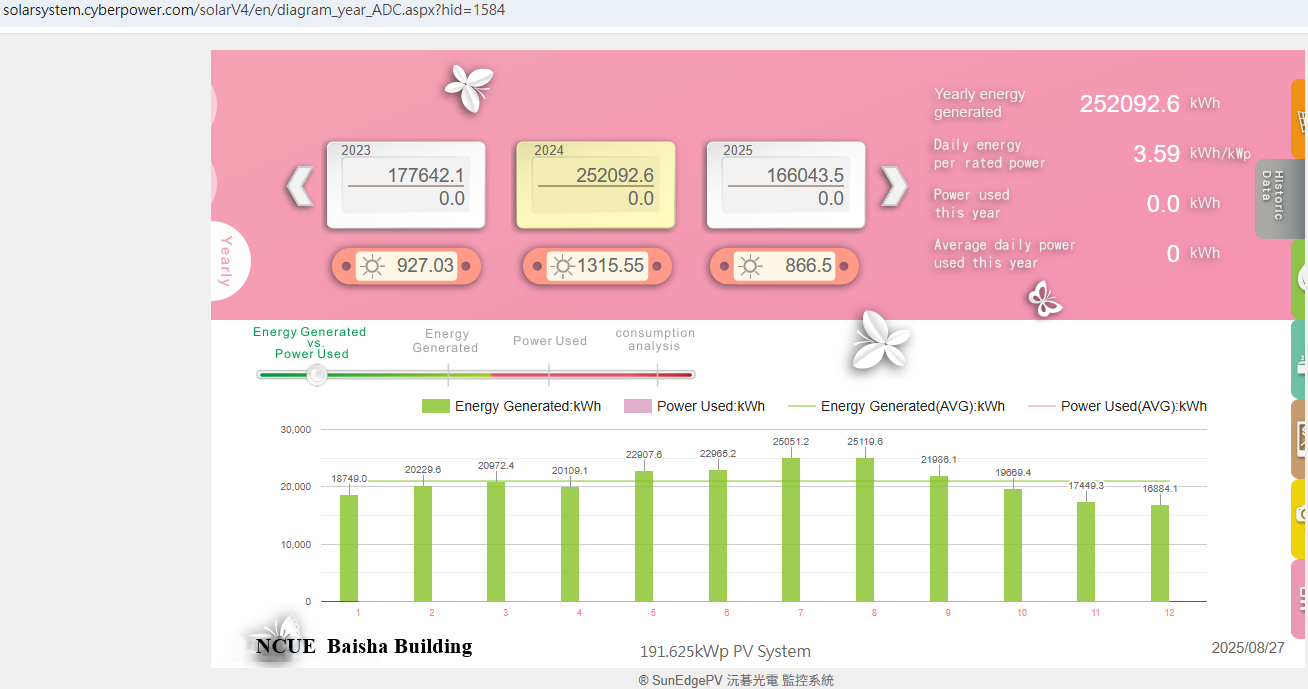
Figure 3. Baisha Building at Jinde Campus: 2024 Annual Power Generation Data Query Screenshot
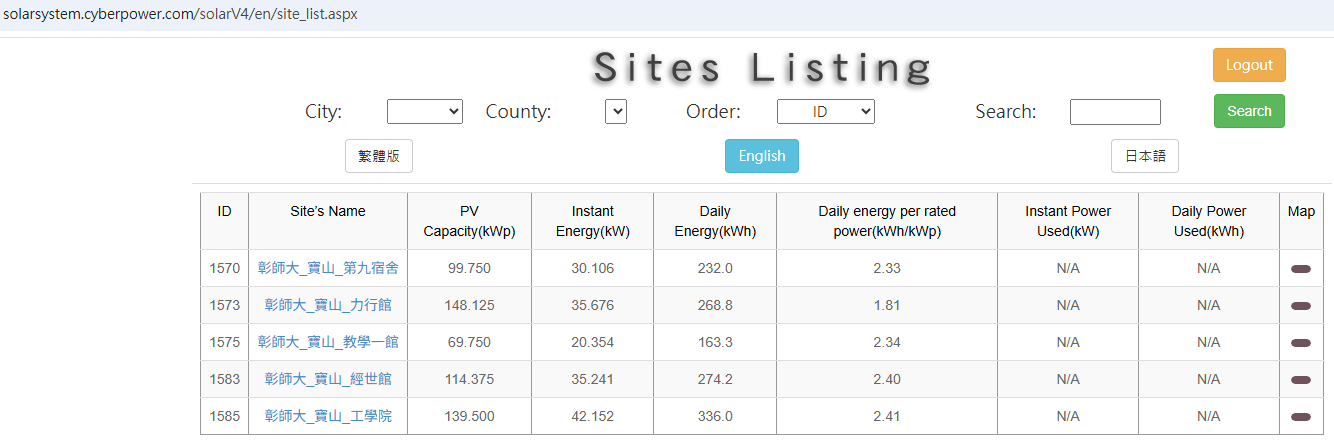
Figure 4. Solar Power Monitoring System in Other Campus Buildings Website - Baoshan Campus Site List Management Interface
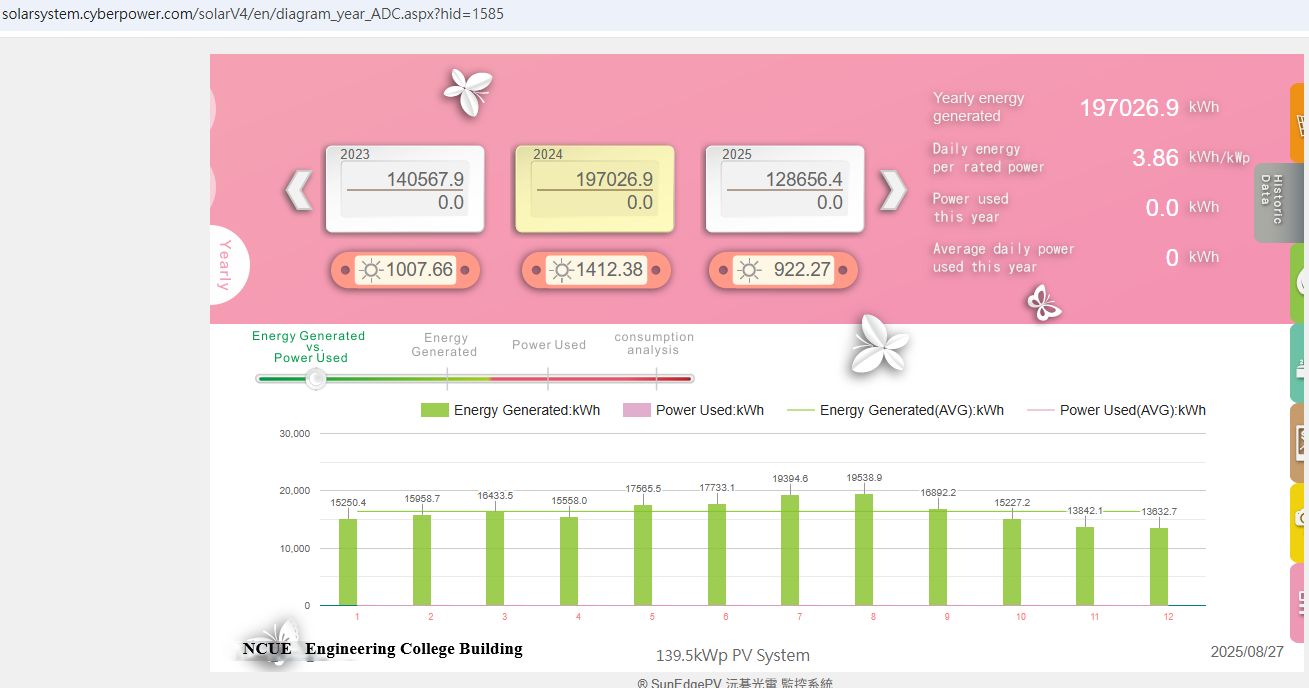
Figure 5. College of Engineering Baoshan Campus: 2024 Annual Power Generation Data Query Screenshot