SDG 13.2.2 Low-carbon energy use
Total energy used
At NCUE’s Jinde Campus, the total electricity consumption for 2022 was 8,561,240 kWh, while at the Baoshan Campus, the total electricity consumption for 2022 was 3,840,380 kWh. The total electricity consumption for the entire University in 2022 was 12,401,620 kWh, equivalent to 44,464.83 GJ.
Total energy used from low-carbon sources
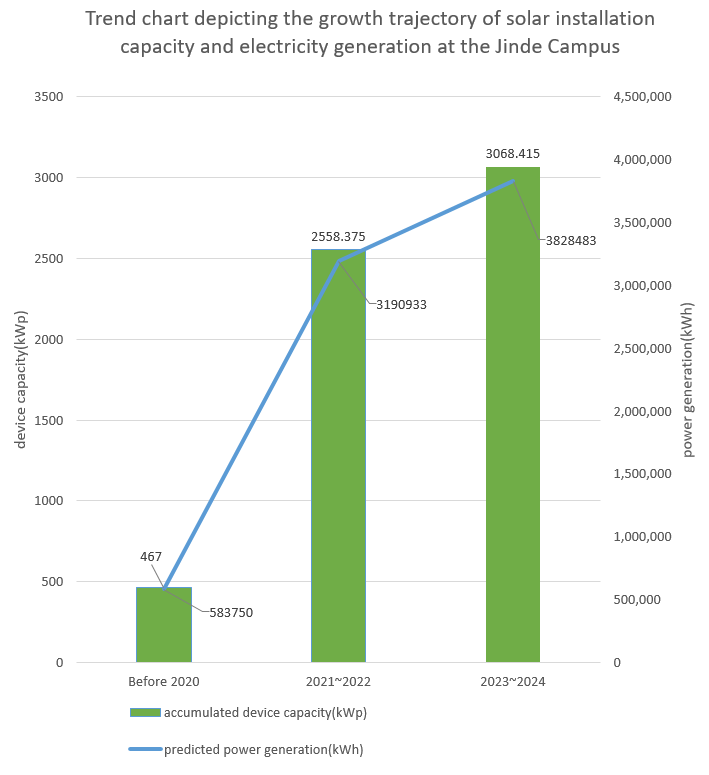
1. In 2017, Jinde Campus installed a photovoltaic solar power system that generated 467 kwp osf power. As of July 2023, the cumulative total electricity generated has exceeded 3,480,000 kWh (>12,541 GJ), with an average annual power generation of 583,750 kWh (2,101.5 GJ), accounting for 4.70% of the total power consumption of the University in 2022.
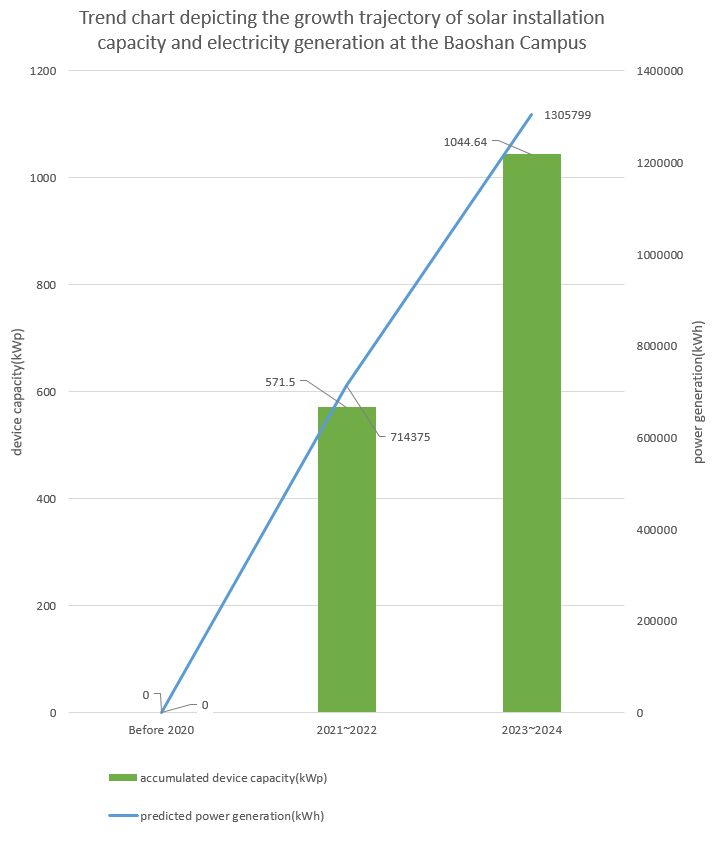
2. It is expected that in academic year 2021-2022, the annual solar power generation of Jinde Campus will increase to 3,197,968 kWh (11,512 GJ), and that of Baoshan Campus will increase to 714,375 kWh (2,572 GJ), which will account for more than 30% of the University’s total power consumption for the academic year.
3. For academic year 2023-2024, there are plans to further increase the annual solar power generation capacities to 3,828,483 kWh (13,782 GJ) and 1,305,799 kWh (4,700 GJ), respectively, on Jinde and Baoshan Campuses.
4. It is estimated that by 2024, the University’s total solar power generation will reach 5,134,282 kWh (18,483 GJ), which would represent 40% of the total power consumption in 2022. Table 1 summarizes the University’s use of low carbon energy from 2021 to 2024.
Table 1. NCUE 2021-2024 Total Usage of Low-Carbon Energy
|
Campus |
Year |
Newly Added Capacity (kWp) |
Accumulated Capacity (kWp) |
Expected Power Generation (kWh) |
% of Total Power Consumption in 2022 |
|
Jinde |
Before 2020 |
467 |
467 |
583,750 |
6.7% |
|
2021-2022 |
2,091.375 |
2,558.375 |
3,197,968 |
37.35% |
|
|
2023-2024 |
510.04 |
3,068.415 |
3,835,518 |
44.80% |
|
|
Baoshan |
Before 2020 |
0 |
0 |
0 |
0% |
|
2021-2022 |
571.5 |
571.5 |
714,375 |
19.63% |
|
|
2023-2024 |
473.14 |
1,044.64 |
1,305,799 |
35.88% |
|
|
Total |
Before 2020 |
467 |
467 |
583,750 |
4.73% |
|
2021-2022 |
2,657.25 |
3,124.25 |
3,905,308 |
31.62% |
|
|
2023-2024 |
983.18 |
4,107.43 |
5,134,282 |
41.57% |
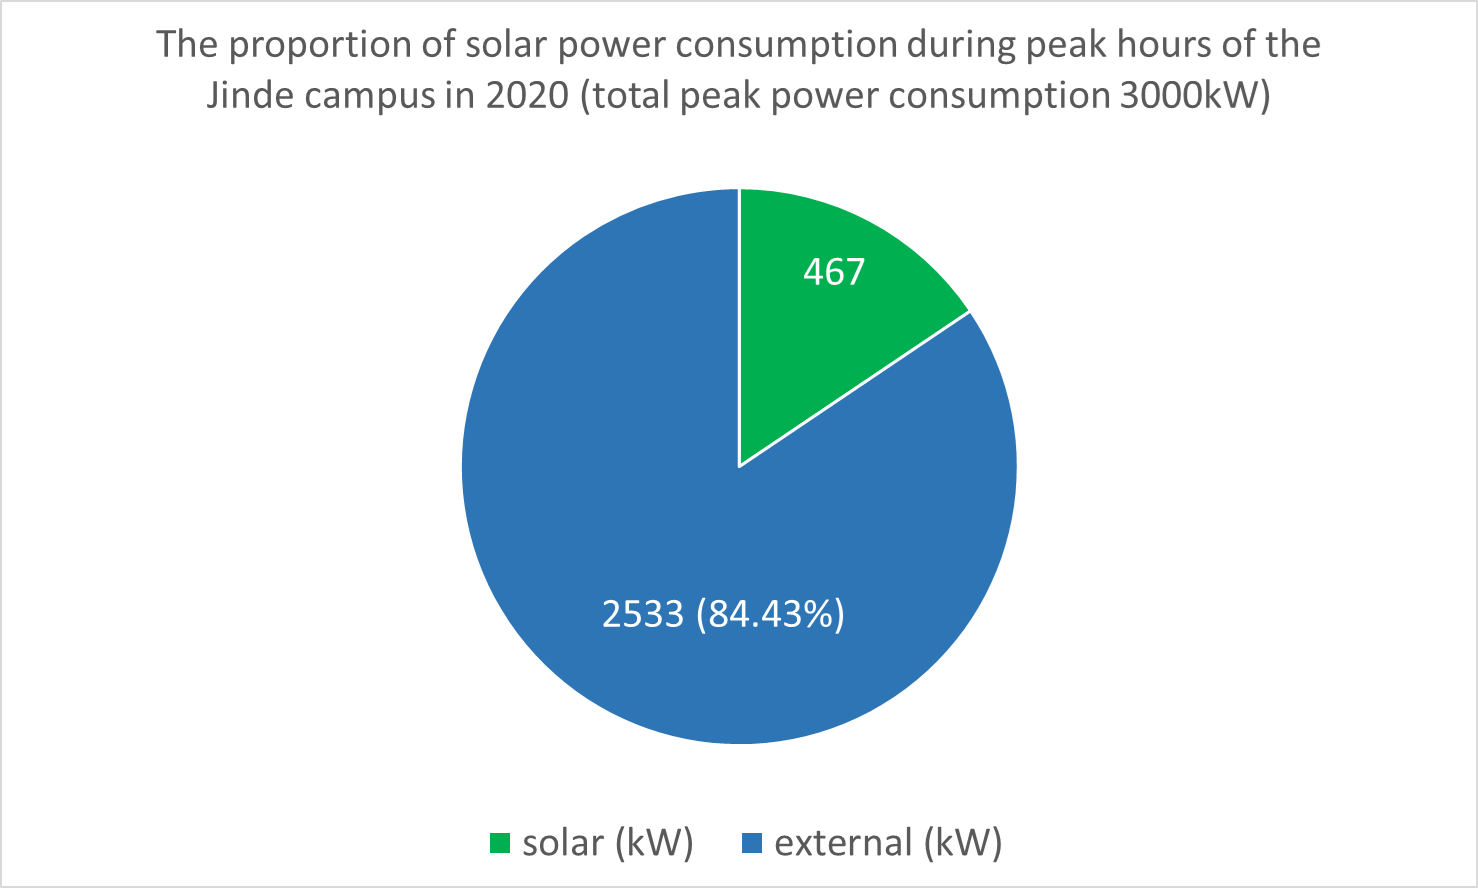
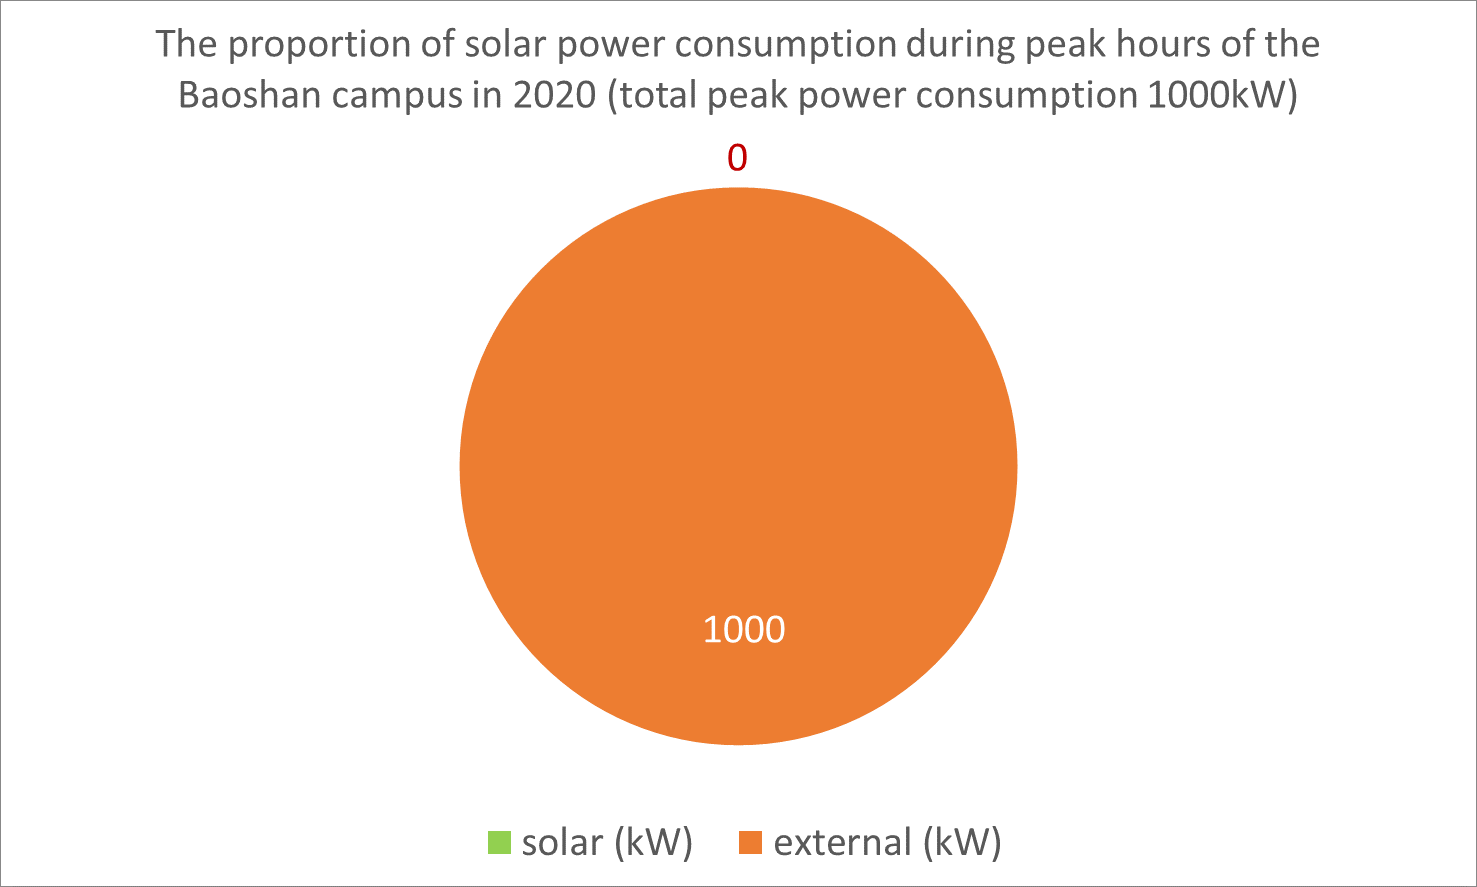
5. The University is striving for carbon neutrality. Prior to 2020, during peak hours, solar energy generated on Jinde campus was 467 kW, and low-carbon energy accounted for approximately 15.57% of total power consumption (3,000 kW), whereas Baoshan campus consumed 1,000 kW, which was not from low-carbon sources.
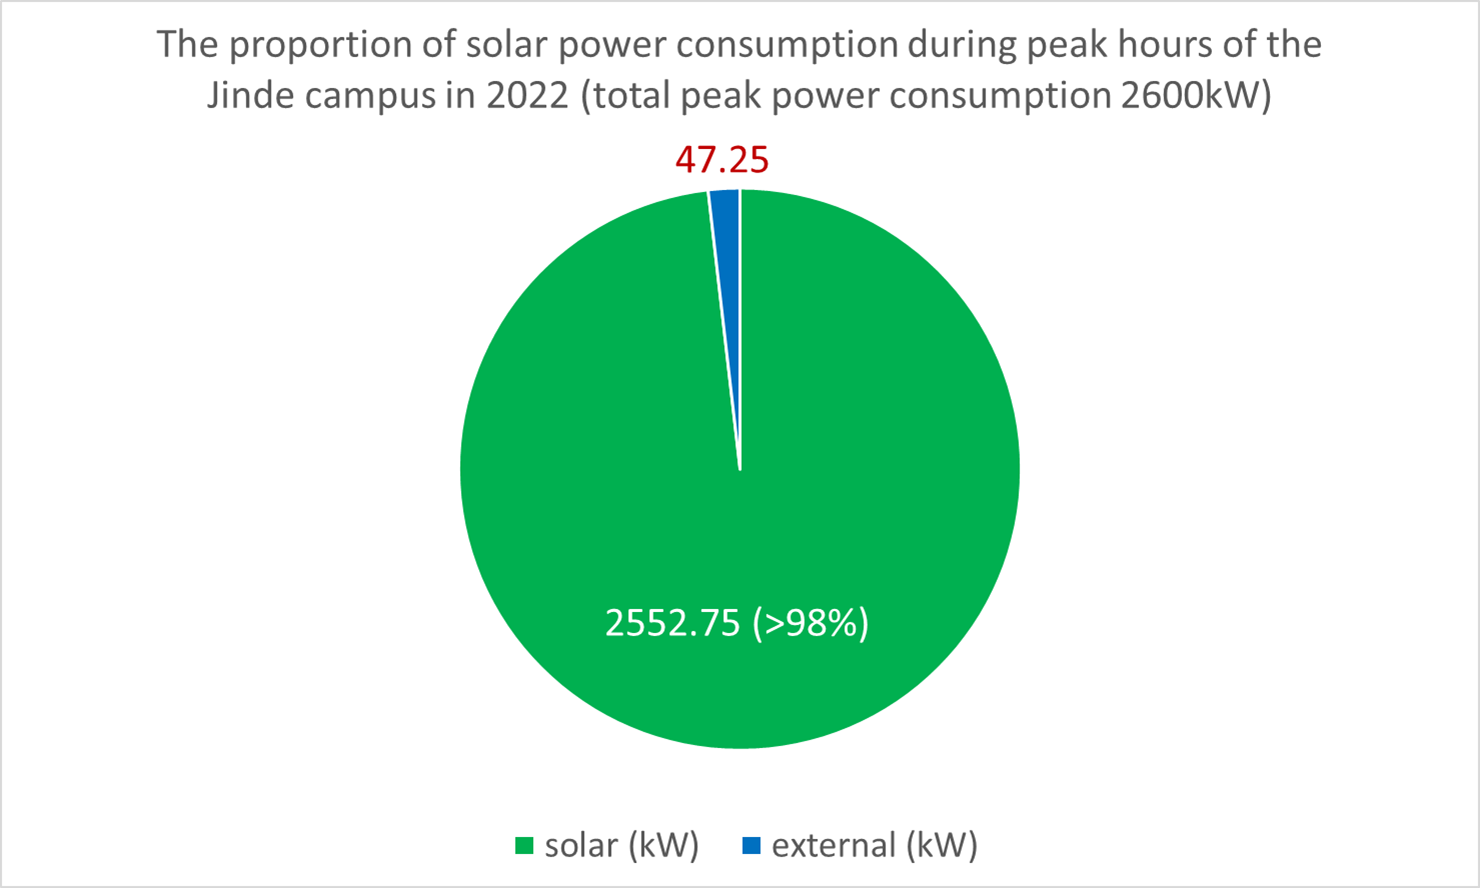
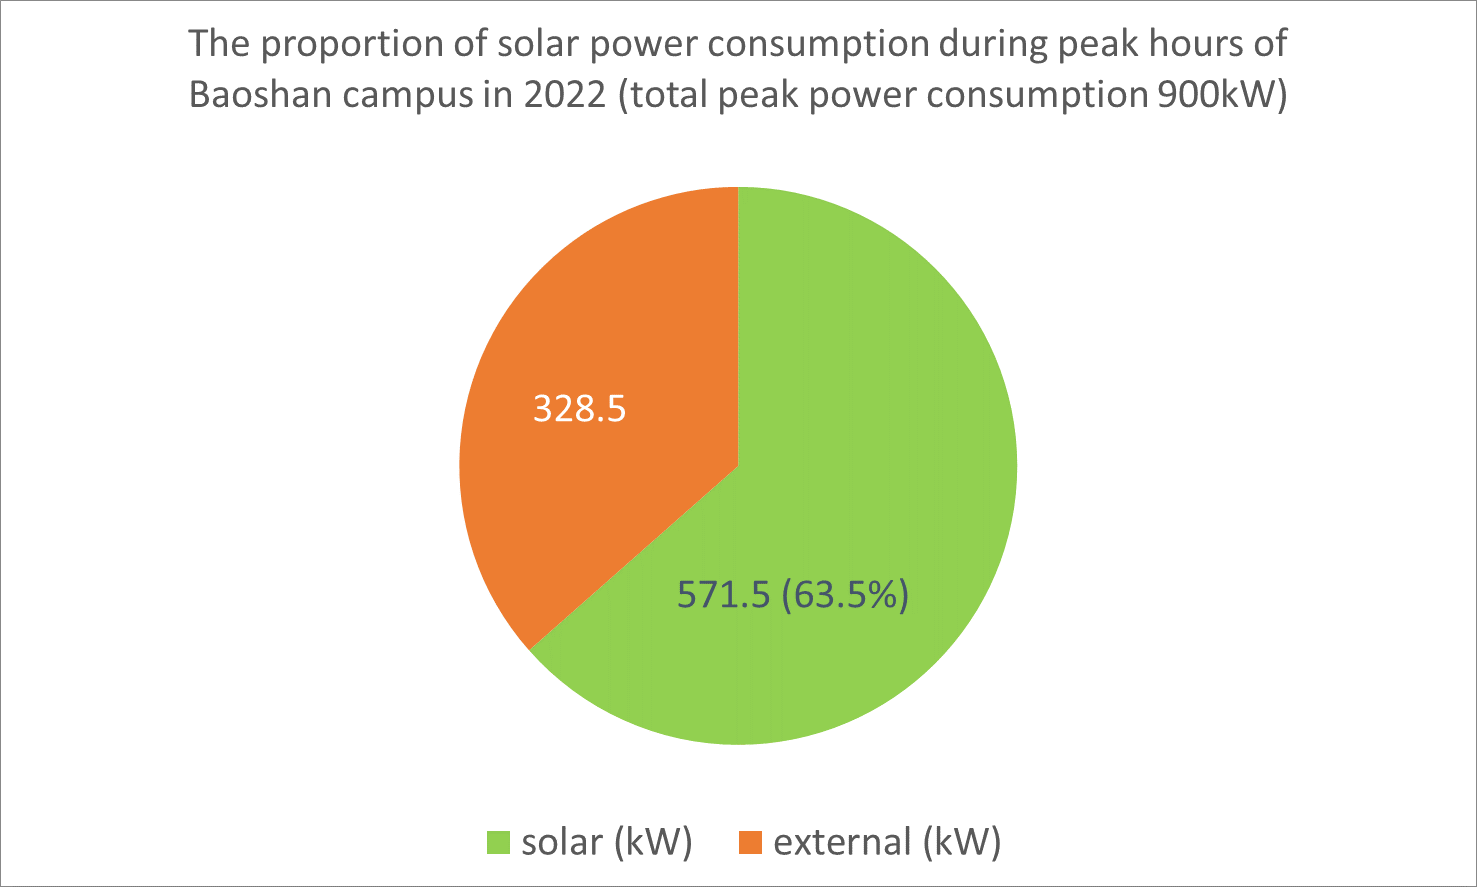
6. It is expected that in academic year 2021-2022, total solar energy generated on Jinde Campus will increase to 2,552.75 kW during peak hours, whereas power consumption will reduce to 2,600 kW, which will push low-carbon energy sources to 98.18% of the total energy consumed. On Baoshan Campus, solar power generation is expected to increase to 571.5 kW during peak hours, whereas power consumption is expected to reduce to 900 kW, increasing low-carbon energy sources to 63.5% of the total power consumed.
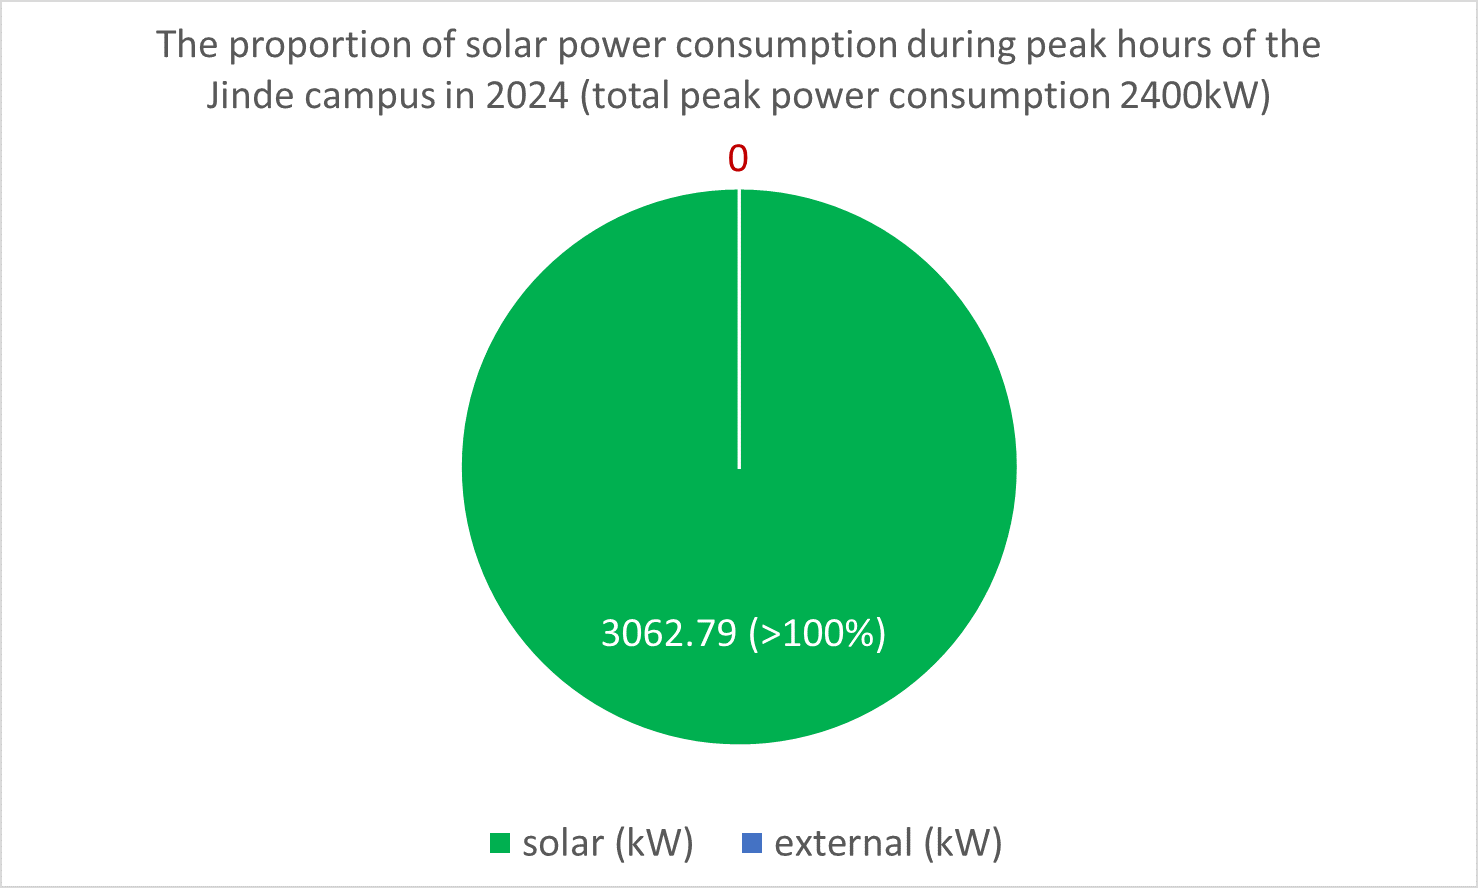
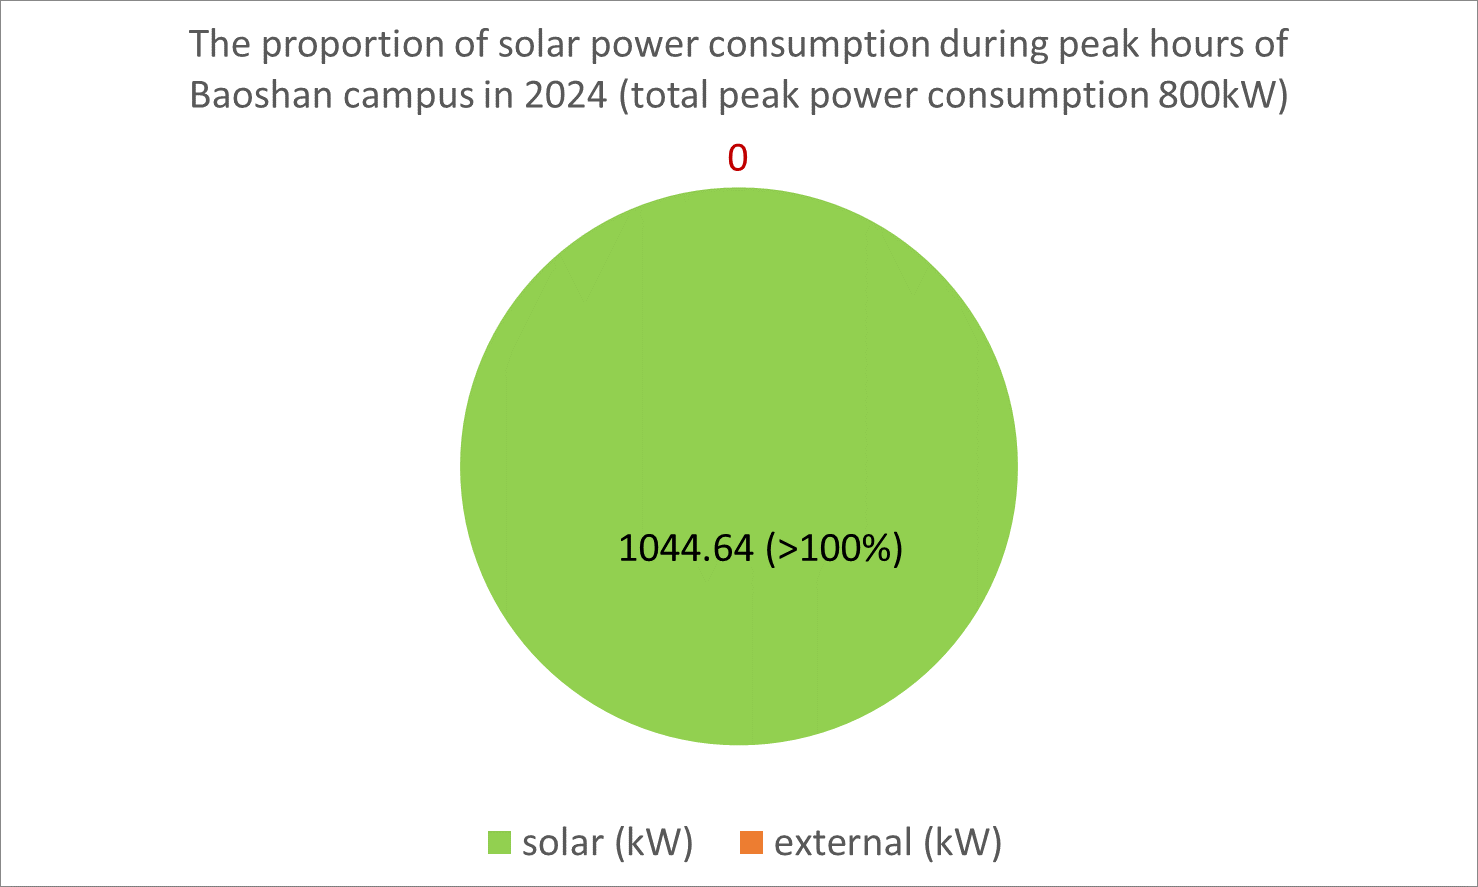
7. The target for the academic year 2023-2024 is to increase solar power generation to 3,062.79 kW during peak hours and reduce power consumption to 2,400 kW on Jinde Campus, with low-carbon energy exceeding 100% of the total energy consumed. Similarly, for Baoshan Campus, it is expected that solar power generation will increase to 1,044.64 kW during peak hours and power consumption will reduce to 800 kW, with low-carbon energy exceeding 100% of the total energy consumed. The excess power generated will be supplied to neighboring power grids to increase the use of low-carbon energy in the region. Table 2 summarizes the solar power generation capacity to be added between the academic years 2021-2022 and 2023-2024.
Table 2. NCUE 2021-2024 total planned capacity of new solar photovoltaic power installations
|
Campus |
Year |
Solar Energy Generated during Peak Hours (kW) |
Power Consumption during Peak Hours (kW) |
Proportion of Solar Power to Power Consumption |
|
Jinde |
Before 2020 |
467 |
3,000 |
15.57% |
|
2021-2022 |
2,558.375 |
2,600 |
98.18% |
|
|
2023-2024 |
3,068.415 |
2,400 |
>100% |
|
|
Baoshan |
Before 2020 |
0 |
1,000 |
0% |
|
2021-2022 |
571.5 |
900 |
63.5% |
|
|
2023-2024 |
1,044.64 |
800 |
>100% |
(1)The following table presents the detailed distribution of Solar photovoltaic power generation facility newly installed in academic year 2021-2022 (by building), as shown in Table 3.
Table 3. NCUE 2021-2024 total planned capacity of new Solar photovoltaic power installations
|
Campus |
Building |
Estimated capacity (kWp) |
(Total) |
Estimated power generation (kwh/year) |
(Total) |
|
Jinde Campus |
Qiaosi Building |
69 |
2,091.375 kWp |
94,687 |
2,607,183 kWh |
|
Baisha Building |
191.625 |
239,531 |
|||
|
Zhishan Building |
48 |
60,000 |
|||
|
Mingde Building |
85.125 |
80,156 |
|||
|
Educational Building |
92.25 |
115,312 |
|||
|
No. 8 Dormitory |
189 |
236,250 |
|||
|
No. 7 Dormitory |
181.5 |
226,875 |
|||
|
No. 6 Dormitory |
88.5 |
110,625 |
|||
|
Hubin Building |
123 |
153,750 |
|||
|
Library |
133.5 |
183,281 |
|||
|
Comprehensive Center |
103.875 |
129,843 |
|||
|
Student Canteen |
146.625 |
183,281 |
|||
|
Shengyang Building |
99.375 |
124,218 |
|||
|
Xuesi Building |
36 |
45,000 |
|||
|
Wang Jinping Activity Center |
160.65 |
192,187 |
|||
|
Wang Jinping Swimming Pool |
239.4 |
302,812 |
|||
|
Old Activity Center |
103.5 |
129,375 |
|||
|
Baoshan Campus |
No. 9 Dormitory |
99.75 |
571.5 kWp |
125,625 |
714,375 kWh |
|
First Educational Building |
69.75 |
126,563 |
|||
|
Engineering College Building |
139.5 |
174,375 |
|||
|
Jingshi Building |
114.375 |
142,969 |
|||
|
Lixing Building |
148.125 |
185,156 |
(2)The solar power consumption percentages during peak hours at the Jinde Campus and the Baoshan Campus of NCUE in 2020 and 2024 are shown in Figures 1-6.
|
|
|
Figure 1. The proportion of solar power consumption during peak hours of the Jinde campus in 2020 |
|
|
|
Figure 2. The proportion of solar power consumption during peak hours of the Jinde campus in 2022 |
|
|
|
Figure 3. The proportion of solar power consumption during peak hours of the Jinde campus in 2024 |
|
|
|
Figure 4. The proportion of solar power consumption during peak hours of the Baoshan campus in 2020 |
|
|
|
Figure 5. The proportion of solar power consumption during peak hours of the Baoshan campus in 2022 |
|
|
|
Figure 6. The proportion of solar power consumption during peak hours of the Baoshan campus in 2024 |
(3)The following table presents the detailed distribution of new solar power generation facilities to be installed during academic year 2023-2024 (for each building) as shown in Table 4. The growth trends of solar installation capacity and electricity generation at the Jinde Campus and the Baoshan Campus are shown in Figures 7-8.
Table 4. Details of the planned new solar power installation distribution at NCUE for 2023-2024
|
Campus |
Building |
Expected Capacity (kWp) |
Total |
Expected Power Generation (kWh/year) |
Total |
|
Jinde |
No. 3 Dormitory |
259.94 |
510.04 kWp |
324,925 |
637,550 kWh |
|
No. 5 Dormitory |
69.7 |
87,125 |
|||
|
Parking lot at the East Gate |
102.5 |
128,125 |
|||
|
Left and right sides of the Torch Tower |
77.9 |
97,375 |
|||
|
Baoshan |
Behind No. 9 Dormitory |
138.99 |
473.14 kWp |
173,737 |
591,424 kWh |
|
Parking lot of No. 9 Dormitory, next to Baoshan Road |
123.41 |
154,262 |
|||
|
Parking lot of the First Educational Building, next to Baoshan Road |
113.98 |
142,475 |
|||
|
Parking lot of the Second Educational Building |
96.76 |
120,950 |
|
|
|
Figure 7. Trend chart depicting the growth trajectory of solar installation capacity and electricity generation at the Jinde Campus |
|
|
|
Figure 8. Trend chart depicting the growth trajectory of solar installation capacity and electricity generation at the Baoshan Campus |