SDG 12.3.1 Waste tracking
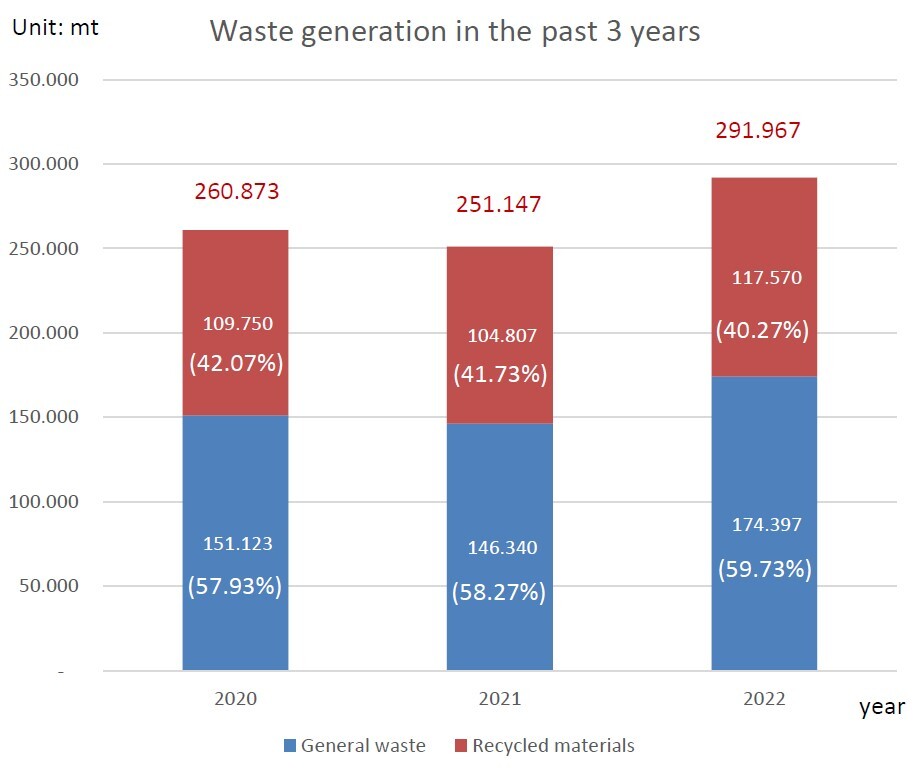
In 2022, NCUE generated 40.27% of recyclable resource waste, while 59.73% were non-recyclable waste. All recyclable resources are recycled at a rate of 100%. Non-recyclable waste is all entrusted to the Changhua City Office for disposal. NCUE requests the Cleaning Squad of the Changhua City Office to provide monthly information on the weight of general waste and recycled materials from NCUE. Recycled materials include the following categories: paper, plastic, glass, iron and aluminum cans, paper containers (meal boxes), PET bottles, and dry batteries, as shown in Table 1, and the waste generation situation at NCUE for the past 3 years, as shown in Figure 1.
Table 1. Weight of general waste and recyclable waste at NCUE in 2022
|
2022 |
Jinde Campus |
Baoshan Campus |
Subtotal of the two campuses |
Total |
Unit |
|||
|
General wastes |
Unit |
General wastes |
Unit |
Recycled materials |
Unit |
|||
|
Jan. |
10,560 |
kg |
4,690 |
kg |
11,870 |
kg |
27,120 |
kg |
|
Feb. |
6,090 |
kg |
1,660 |
kg |
4,730 |
kg |
12,480 |
kg |
|
Mar. |
11,970 |
kg |
5,710 |
kg |
11,525 |
kg |
29,205 |
kg |
|
Apr. |
8,390 |
kg |
4,370 |
kg |
9,160 |
kg |
21,920 |
kg |
|
May |
11,320 |
kg |
4,680 |
kg |
11,560 |
kg |
27,560 |
kg |
|
Jun. |
9,860 |
kg |
3,860 |
kg |
10,895 |
kg |
24,615 |
kg |
|
Jul. |
7,090 |
kg |
2,850 |
kg |
7,140 |
kg |
17,080 |
kg |
|
Aug. |
7,750 |
kg |
2,420 |
kg |
6,815 |
kg |
16,985 |
kg |
|
Sept. |
12,160 |
kg |
5,680 |
kg |
10,920 |
kg |
28,760 |
kg |
|
Oct. |
11,450 |
kg |
5,040 |
kg |
9,995 |
kg |
26,485 |
kg |
|
Nov. |
12,117 |
kg |
5,460 |
kg |
10,510 |
kg |
28,087 |
kg |
|
Dec. |
12,800 |
kg |
6,420 |
kg |
12,450 |
kg |
31,670 |
kg |
|
Total |
121,557 |
kg |
52,840 |
kg |
117,570 |
kg |
291,967 |
kg |
|
Recycled materials account for 40.27% of total waste (or 59.73% of waste that is not recycled) |
||||||||
|
|
|
Figure 1. Waste generated at NCUE over the past 3 years |