SDG 5.5.1 Proportion of female degrees awarded
Number of graduates: Total
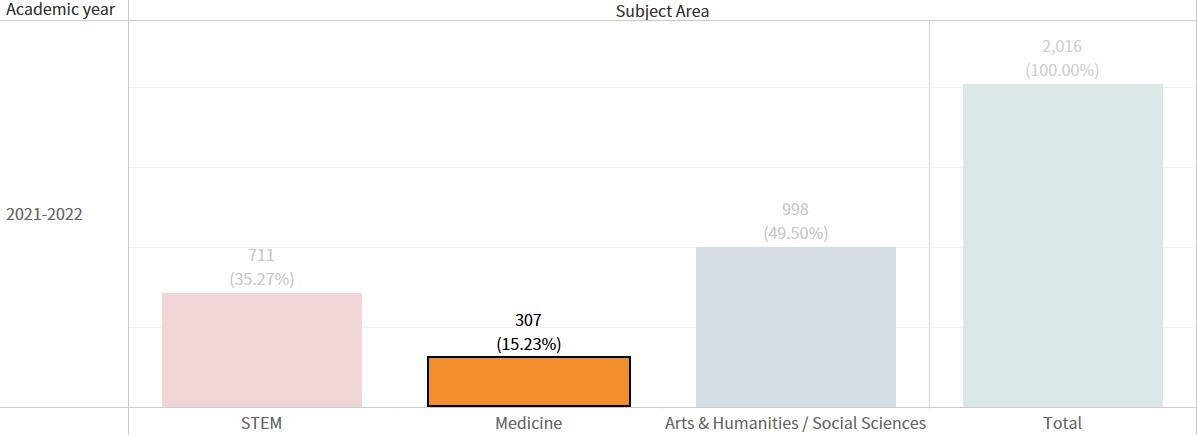
1. Number of graduates by subject area (STEM, Medicine, Arts & Humanities / Social Sciences): Total of 2,016 graduates in 2022, as shown in Figure 1:
|
|
|
Figure 1. Number of graduates by subject area (STEM, Medicine, Arts & Humanities / Social Sciences) in 2022 |
Each subject area is defined as follows:
Medicine: Graduates of Guidance counseling, special education, rehabilitation counseling, sports, and sports and fitness.
STEM: Graduates of science and technology degrees other than the aforementioned.
Arts and Humanities / Social Sciences: Graduates of degrees other than the aforementioned.
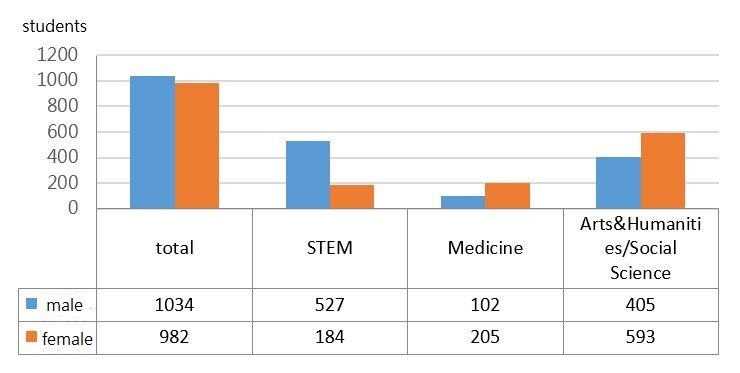
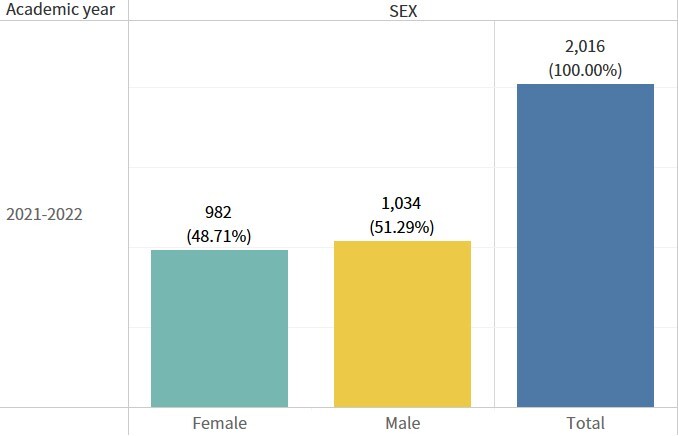
2. Number of male/female graduates by subject area (STEM, Medicine, Arts & Humanities / Social Sciences) in 2022, as shown in Figure 2:
|
|
|
Figure 2. Number of male/female graduates by subject area (STEM, Medicine, Arts & Humanities / Social Sciences) in 2022 |
Number of graduates by subject area: Total
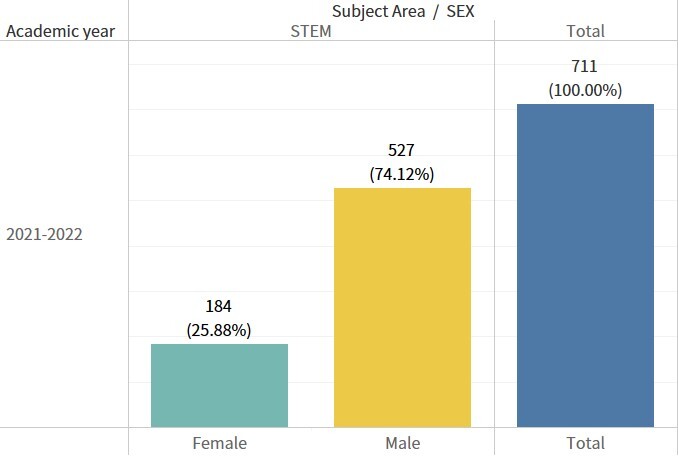
1. Number of graduates: STEM:
711 graduates in 2022, as shown in Figure 3.
|
|
|
Figure 3. Total graduates by subject area (STEM) |
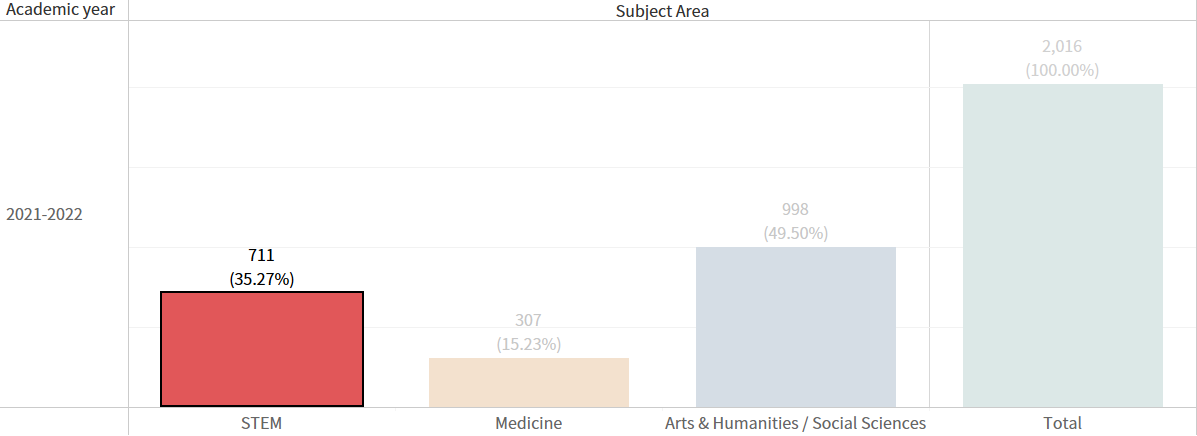
2. Number of graduates: Medicine:
307 graduates in 2022, as shown in Figure 4.
|
|
|
Figure 4. Number of graduates by subject area (Medicine) |
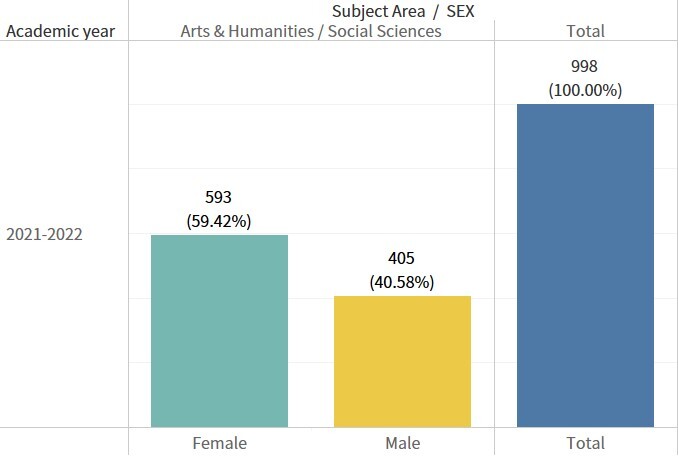
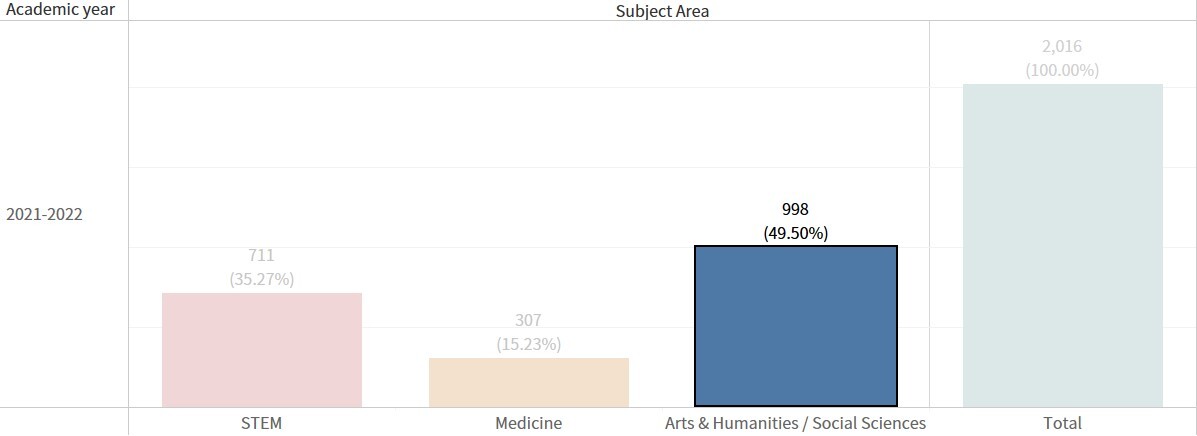
3. Number of graduates: Arts & Humanities / Social Sciences:
998 graduates in 2022, as shown in Figure 5.
|
|
|
Figure 5. Number of graduates by subject area (Arts & Humanities / Social Sciences) |
Number of female graduates by subject area: Total
982 graduates in 2022, as shown in Figure 6.
|
|
|
Figure 6. Number of female graduates by subject area (STEM, Medicine, Arts & Humanities / Social Sciences) |
1. Number of female graduates: STEM:
184 graduates in 2022, which increased by 16 graduates (9.52%) compared to the 168 graduates in 2021, as shown in Figure 7.
|
|
|
Figure 7. A total of 184 female graduates by subject area (STEM) |
2. Number of female graduates: Medicine:
205 graduates in 2022, as shown in Figure 8.
|
|
|
Figure 8. Number of female graduates by subject area (Medicine) |

3. Number of female graduates: Arts & Humanities / Social Sciences:
593 graduates in 2022, as shown in Figure 9.
|
|
|
Figure 9. Number of female graduates by subject area (Arts & Humanities / Social Sciences) |